November 24, 2025 a 07:46 am

📊 MDT: Dividend Analysis - Medtronic plc
Medtronic plc has established itself as a strong dividend-paying company with a remarkable dividend history of 44 years. With a current dividend yield of nearly 3%, it provides a compelling case for income-seeking investors. The company's recent dividend growth rates, though modest, demonstrate consistency, making it a reliable choice for those who value dividend stability. However, potential investors should be cautious of the payout ratios, indicating a higher percentage of earnings being returned as dividends. Overall, Medtronic remains a prominent player in the healthcare sector with potential for sustained income distribution.
📈 Overview
Medtronic plc is a key player in the healthcare sector, known for its substantial dividend yield and long-standing history of dividend payments. Let's delve into the key figures that depict the company's financial health and its commitment to returning value to shareholders through dividends.
| Metric | Value |
|---|---|
| Sector | Healthcare |
| Dividend yield | 2.99% |
| Current dividend per share | $2.79 |
| Dividend history | 44 years |
| Last cut or suspension | None |
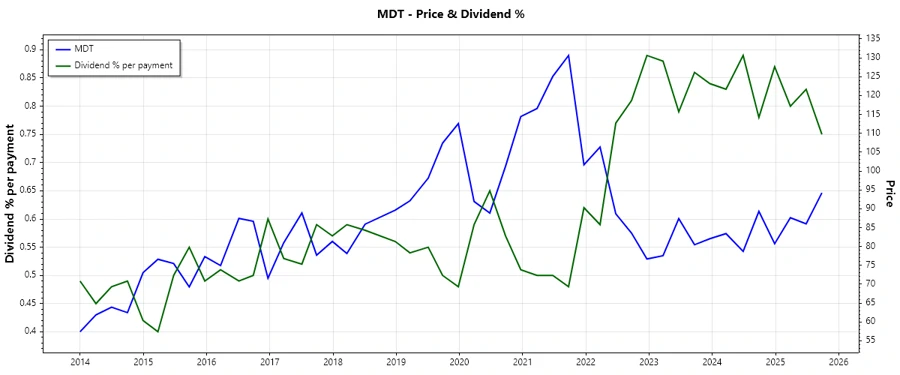
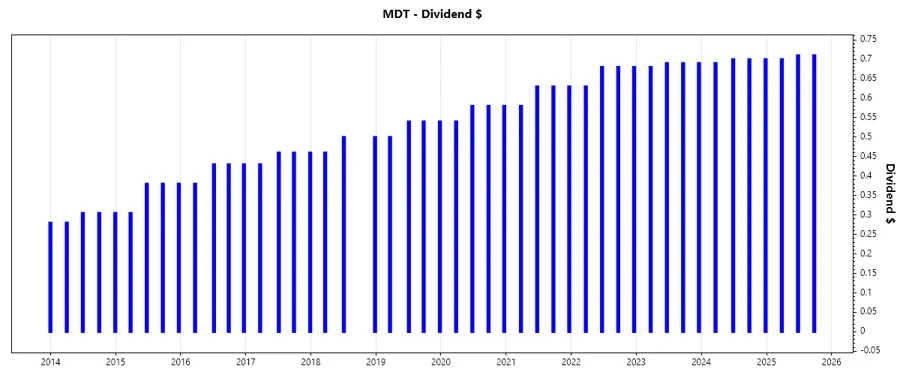
🌟 Dividend History
Analyzing historical dividend payments provides insights into the company's financial stability and commitment to rewarding shareholders. Medtronic’s uninterrupted history of payments over decades signifies a reliable income stream for long-term investors.
| Year | Dividend per Share (USD) |
|---|---|
| 2025 | $2.12 |
| 2024 | $2.79 |
| 2023 | $2.75 |
| 2022 | $2.67 |
| 2021 | $2.47 |
📈 Dividend Growth
Dividend growth rates are critical for understanding the potential income growth from holding the stock. Medtronic's dividend growth over the past three and five years suggests a steady increase, albeit at a moderate pace, which can predict future income enhancement for investors.
| Time | Growth |
|---|---|
| 3 years | 4.14% |
| 5 years | 5.65% |
The average dividend growth is 5.65% over 5 years. This shows moderate but steady dividend growth, reflecting Medtronic's focus on long-term shareholder value enhancement.
⚖️ Payout Ratio
A company's payout ratio offers insight into the sustainability of its dividend payments. Medtronic exhibits an EPS-based payout ratio of 75.10% and a free cash flow-based payout ratio of 67.53%. This indicates a comfortable distribution strategy, although investors should watch for any potential constraints on future growth.
| Key figure | Ratio |
|---|---|
| EPS-based | 75.10% |
| Free cash flow-based | 67.53% |
The payout ratio shows a balanced approach in earnings and cash flow use, supportive for continued dividend payouts without compromising growth opportunities.
💧 Cashflow & Capital Efficiency
Evaluating cashflow-related metrics helps assess a company's capability to support its operations and dividend distribution, directly impacting shareholder returns.
| Year | 2023 | 2024 | 2025 |
|---|---|---|---|
| Free Cash Flow Yield | 3.80% | 4.88% | 4.76% |
| Earnings Yield | 3.12% | 4.28% | 4.48% |
| CAPEX to Operating Cash Flow | 24.16% | 23.38% | 26.39% |
| Stock-based Compensation to Revenue | 1.14% | 1.21% | 1.28% |
| Free Cash Flow / Operating Cash Flow Ratio | 75.84% | 76.62% | 73.61% |
The capital efficiency metrics demonstrate Medtronic's ability to maintain robust operational performance and financial strength, crucial for sustained growth and dividend coverage.
⚖️ Balance Sheet & Leverage Analysis
The balance sheet and leverage ratios provide insight into a company's financial health, risks, and its ability to fulfill long-term obligations, critical for determining investor confidence.
| Year | 2023 | 2024 | 2025 |
|---|---|---|---|
| Debt-to-Equity | 47.32% | 49.83% | 59.38% |
| Debt-to-Assets | 26.79% | 27.81% | 31.10% |
| Debt-to-Capital | 32.12% | 33.26% | 37.26% |
| Net Debt to EBITDA | 2.62 | 2.89 | 2.85 |
| Current Ratio | 2.39 | 2.03 | 1.85 |
| Quick Ratio | 1.81 | 1.55 | 1.42 |
| Financial Leverage | 1.77 | 1.79 | 1.91 |
Balance sheet metrics suggest Medtronic operates with a balanced leverage ratio, signifying financial flexibility and manageable debt levels, enhancing its overall stability.
💪 Fundamental Strength & Profitability
Close examination of fundamental and profitability metrics shed light on Medtronic's operational efficiency and capacity to yield profit, supporting its dividend strategy.
| Year | 2023 | 2024 | 2025 |
|---|---|---|---|
| Return on Equity | 7.30% | 7.32% | 9.71% |
| Return on Assets | 4.13% | 4.09% | 5.09% |
| Net Margin | 12.03% | 11.36% | 13.90% |
| EBIT Margin | 19.21% | 17.17% | 18.95% |
| EBITDA Margin | 27.85% | 25.35% | 27.49% |
| Gross Margin | 65.67% | 65.34% | 65.32% |
| R&D to Revenue | 8.63% | 8.45% | 8.15% |
Medtronic exhibits solid profitability metrics, emphasizing efficient asset use and steady margins, which fortify its capacity to perpetuate dividend payments amidst competitive market dynamics.
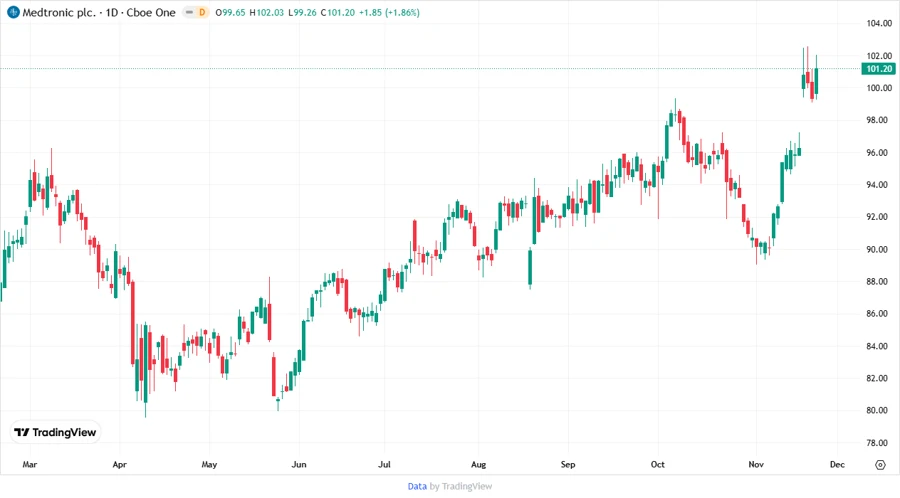
📉 Price Development
✅ Dividend Scoring System
| Category | Score | Indicator |
|---|---|---|
| Dividend yield | 4 | |
| Dividend Stability | 5 | |
| Dividend growth | 3 | |
| Payout ratio | 3 | |
| Financial stability | 4 | |
| Dividend continuity | 5 | |
| Cashflow Coverage | 4 | |
| Balance Sheet Quality | 4 |
Total Score: 32 out of 40
📋 Rating
Medtronic plc exhibits strong dividend characteristics, with stable history and reliable economic foundations. The company receives high marks for dividend stability and payout ratios, making it a solid choice for income-oriented investors seeking consistency and modest growth. A balanced strategy in leveraging and financial infrastructure underscores its suitability for sustainable dividends. It’s recommended for long-term portfolios favoring conservative growth and stability in dividend income.
Smart Data Insight
Master the Perfect Entry & Exit for this Stock
Don't leave your profits to chance. Historically, this stock follows specific seasonal patterns that institutional traders use to maximize returns.
- ✅ Identify the "Golden Buying Window"
- ✅ Avoid high-risk correction cycles
- ✅ Backtested data from the last 20+ years