October 16, 2025 a 07:47 am
MDT: Dividend Analysis - Medtronic plc
Medtronic plc has established a robust dividend payment history, suggesting a reliable and mature business model in the healthcare sector. With a current dividend yield of nearly 3%, it provides a steady income stream for investors. The company's long history of dividend payments, spanning over four decades, emphasizes its commitment to returning value to shareholders. However, the elevated EPS payout ratio suggests that there could be limitations on increasing dividend payments in the future without corresponding earnings growth.
📊 Overview
Medtronic operates in the healthcare sector, offering a dividend yield of 2.99% and a current dividend per share of $2.79. The company boasts an impressive 44-year history of continuous dividend payments without any recent cuts or suspensions, underscoring its financial stability and commitment to shareholders.
| Category | Details |
|---|---|
| Sector | Healthcare |
| Dividend yield | 2.99% |
| Current dividend per share | $2.79 |
| Dividend history | 44 years |
| Last cut or suspension | None |
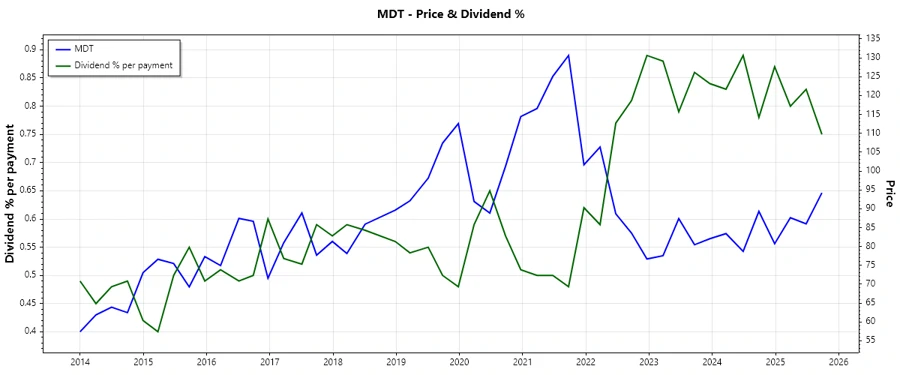
📈 Dividend History
Medtronic's robust dividend history reflects a stable and growing payment policy, which is appealing to income-focused investors. Maintaining a lengthy history without cuts indicates strong corporate governance and financial health, reassuring stakeholders of the company's consistency in achieving dividend objectives.
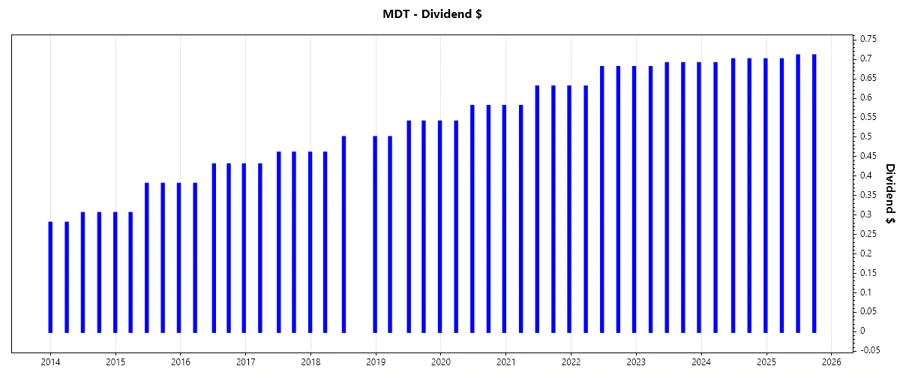
| Year | Dividend per Share (USD) |
|---|---|
| 2025 | $2.12 |
| 2024 | $2.79 |
| 2023 | $2.75 |
| 2022 | $2.67 |
| 2021 | $2.47 |
📈 Dividend Growth
The historical dividend growth rate highlights Medtronic's potential for sustainable dividend expansion. With modest growth over the past 3 and 5 years, investors can anticipate ongoing revenue and earnings growth to support future dividend increase expectations.
| Time | Growth |
|---|---|
| 3 years | 0.04% |
| 5 years | 0.06% |
The average dividend growth is 0.06% over 5 years. This shows moderate but steady dividend growth.
✅ Payout Ratio
Evaluating payout ratios helps determine the sustainability of dividends. An EPS-based payout ratio of 76.76% indicates that a significant portion of earnings is directed to dividend payments. The FCF-based payout ratio of 67.52% suggests a more conservative approach, providing some buffer for reinvestment or debt reduction.
| Key figure | Ratio |
|---|---|
| EPS-based | 76.76% |
| Free cash flow-based | 67.52% |
The current payout ratios suggest a manageable level of commitment to dividends, though the EPS ratio is on the higher side, requiring careful monitoring against earnings growth.
📈 Cashflow & Capital Efficiency
The cash flow and capital efficiency metrics are pivotal indicators of a company's ability to sustain operations, invest in growth, and pay dividends. Medtronic shows strong cash flow management and efficient capital allocation, as reflected in its metrics.
| Year | 2025 | 2024 | 2023 |
|---|---|---|---|
| Free Cash Flow Yield | 4.79% | 4.91% | 3.79% |
| Earnings Yield | 4.31% | 3.47% | 3.11% |
| CAPEX to Operating Cash Flow | 25.79% | 23.38% | 24.16% |
| Stock-based Compensation to Revenue | 1.27% | 1.21% | 1.14% |
| Free Cash Flow / Operating Cash Flow Ratio | 73.61% | 76.62% | 75.84% |
The robust cash flow generation and efficient capital utilization indicate a firm foundation for supporting dividends, alongside operational expansions.
📉 Balance Sheet & Leverage Analysis
Maintaining a healthy balance sheet ensures the company's ability to meet financial obligations while providing security for dividend continuity. Medtronic displays balanced leverage ratios, highlighting manageable debt levels and good liquidity.
| Year | 2025 | 2024 | 2023 |
|---|---|---|---|
| Debt-to-Equity | 0.59 | 0.50 | 0.47 |
| Debt-to-Assets | 0.31 | 0.28 | 0.27 |
| Debt-to-Capital | 0.37 | 0.33 | 0.32 |
| Net Debt to EBITDA | 2.93 | 2.89 | 2.62 |
| Current Ratio | 2.01 | 2.03 | 2.39 |
| Quick Ratio | 1.42 | 1.55 | 1.81 |
| Financial Leverage | 1.91 | 1.79 | 1.77 |
Medtronic's stability in financial ratios and moderate debt levels suggest a solid financial stance, supporting a safe dividend profile amidst varying market conditions.
🗣️ Fundamental Strength & Profitability
Evaluating profitability ratios ensures the company's ability to consistently generate earnings, supporting operations and dividends. Medtronic's margins and ROE ratios point towards efficient operations and sound financial health.
| Year | 2025 | 2024 | 2023 |
|---|---|---|---|
| Return on Equity | 9.71% | 7.32% | 7.30% |
| Return on Assets | 5.09% | 4.09% | 4.13% |
| Margins: Net | 13.90% | 11.36% | 12.03% |
| Margins: EBIT | 18.96% | 17.17% | 19.21% |
| Margins: EBITDA | 27.49% | 25.35% | 27.85% |
| Margins: Gross | 65.32% | 65.34% | 65.67% |
| Research & Development to Revenue | 8.13% | 8.45% | 8.63% |
The company's focused investment in R&D alongside superior margins ensures competitiveness and sustainability, backing its dividend policy.
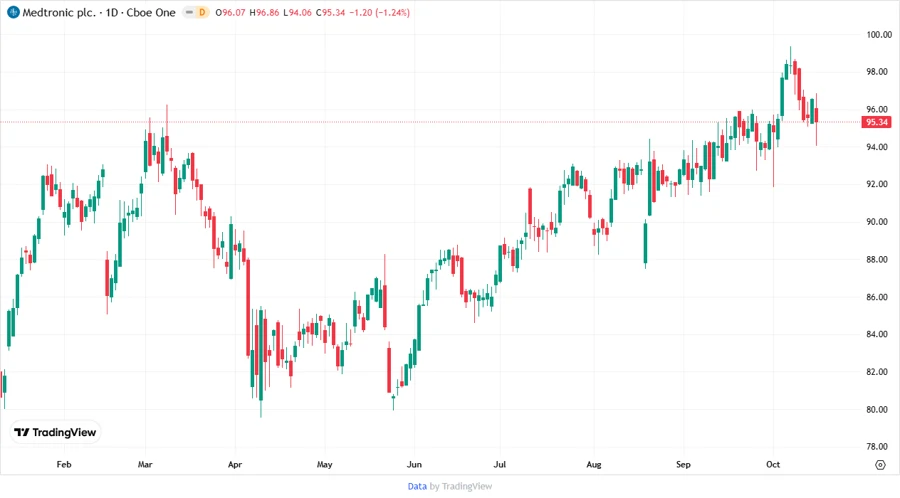
🌡️ Price Development
💡 Dividend Scoring System
| Criteria | Score | Score Bar |
|---|---|---|
| Dividend yield | 4 | |
| Dividend Stability | 5 | |
| Dividend growth | 3 | |
| Payout ratio | 3 | |
| Financial stability | 4 | |
| Dividend continuity | 5 | |
| Cashflow Coverage | 4 | |
| Balance Sheet Quality | 5 |
Total Score: 33/40
📊 Rating
Medtronic plc demonstrates sound financial health with consistent dividend payments, making it an attractive option for income-seeking investors. The company balances moderate growth with stability, supporting its strong dividend policy. Therefore, Medtronic earns a favorable rating as a reliable dividend-paying stock with solid prospects for ongoing shareholder value enhancement.
Smart Data Insight
Master the Perfect Entry & Exit for this Stock
Don't leave your profits to chance. Historically, this stock follows specific seasonal patterns that institutional traders use to maximize returns.
- ✅ Identify the "Golden Buying Window"
- ✅ Avoid high-risk correction cycles
- ✅ Backtested data from the last 20+ years