July 08, 2025 a 04:03 am

MDLZ: Trend and Support & Resistance Analysis - Mondelez International, Inc.
Mondelez International, Inc., known for a wide range of snack food and beverage products, shows resilience in the face of market fluctuations. Recent technical analysis indicates a slight upward momentum with well-defined support zones. Traders should remain alert for any shifts that may impact stock prices.
Trend Analysis
The Mondelez stock has experienced fluctuations over recent months. The calculated moving averages reveal a dominant upward trend. The EMA20 is higher than the EMA50, confirming the upward movement. Below is the table with the analysis for the last 7 days.
| Date | Close Price | Trend |
|---|---|---|
| 07-07-2025 | 68.82 | ▲ Upward |
| 07-03-2025 | 68.99 | ▲ Upward |
| 07-02-2025 | 69.56 | ▲ Upward |
| 07-01-2025 | 68.96 | ▲ Upward |
| 06-30-2025 | 67.44 | ▲ Upward |
| 06-27-2025 | 67.78 | ▲ Upward |
| 06-26-2025 | 67.75 | ▲ Upward |
The consistent upward trend indicates strong market confidence and potential for future gains, should external market conditions remain favorable.
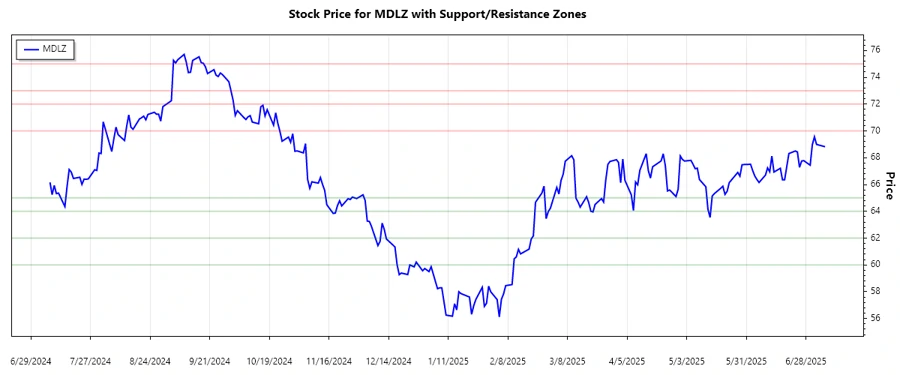
Support and Resistance
Based on the historical data, the analysis shows clear support and resistance levels. This can provide insight into future price movements.
| Zone Type | From | To | Status |
|---|---|---|---|
| Support Zone 1 | 64.00 | 65.00 | ▼ Below |
| Support Zone 2 | 60.00 | 62.00 | ▼ Below |
| Resistance Zone 1 | 70.00 | 72.00 | ▲ Above |
| Resistance Zone 2 | 73.00 | 75.00 | ▲ Above |
Currently, the MDLZ stock price is moving within the resistance zones, suggesting pressure for potential breaking above recent highs.
Conclusion
Mondelez International, Inc. displays a promising upward trend, potentially offering opportunities for growth-focused investors. However, the proximity to resistance levels demands caution and close monitoring. The stock’s movements within identified support and resistance zones allow for strategic trading positions to mitigate risks while capitalizing on trend continuations. Analysts must weigh both technical indicators and market forces to gauge potential stock performance accurately.
Smart Data Insight
Master the Perfect Entry & Exit for this Stock
Don't leave your profits to chance. Historically, this stock follows specific seasonal patterns that institutional traders use to maximize returns.
- ✅ Identify the "Golden Buying Window"
- ✅ Avoid high-risk correction cycles
- ✅ Backtested data from the last 20+ years