May 09, 2026 a 05:15 am

MDLZ: Fibonacci Analysis - Mondelez International, Inc.
The Mondelez International, Inc. (MDLZ) stock has demonstrated a notable recovery from its previous lows in early 2026. With a diverse portfolio of snack brands and a broad geographical market reach, Mondelez seems well-poised to capitalize on increasing global snack consumption trends. However, investors should remain cautious of potential market volatility influenced by macroeconomic factors and raw material price fluctuations.
Fibonacci Analysis
| Criteria | Details |
|---|---|
| Start Date | 2025-07-29 |
| End Date | 2026-05-08 |
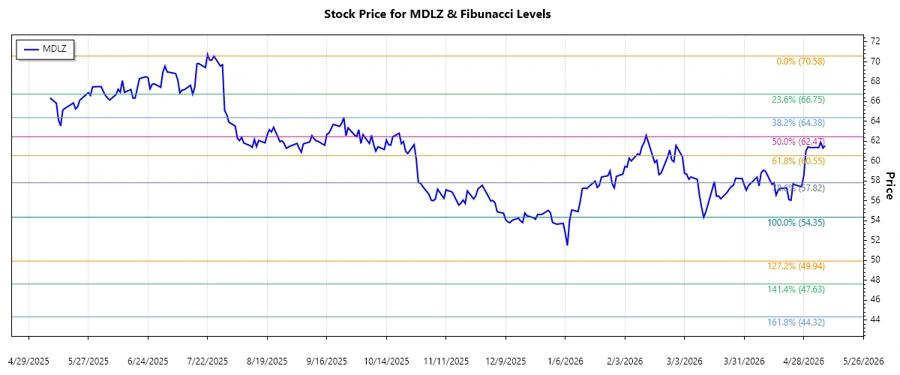
| High Price | $70.58 (2025-07-25) |
| Low Price | $54.35 (2026-03-12) |
| Fibonacci Level | Price Level |
|---|---|
| 0.236 | $58.47 |
| 0.382 | $60.29 |
| 0.5 | $62.47 |
| 0.618 | $63.38 |
| 0.786 | $65.30 |
The current price of $61.55 on 2026-05-08 indicates that the stock is currently hovering around the 50% retracement level. This could be interpreted as a potential resistance zone with mixed signals, requiring vigilant observation of market dynamics.
Conclusion
Mondelez International, Inc. exhibits a promising recovery potential within its prevailing market trend. While the stock curtails near a crucial retracement zone, there is an opportunity for further gains provided positive economic indicators reinforce market sentiment. Nevertheless, the volatile nature of external factors such as commodity prices and currency fluctuations remains a risk, demanding strategic foresight from investors.
Smart Data Insight
Master the Perfect Entry & Exit for this Stock
Don't leave your profits to chance. Historically, this stock follows specific seasonal patterns that institutional traders use to maximize returns.
- ✅ Identify the "Golden Buying Window"
- ✅ Avoid high-risk correction cycles
- ✅ Backtested data from the last 20+ years