November 20, 2025 a 04:45 pm
MDLZ: Fibonacci Analysis - Mondelez International, Inc.
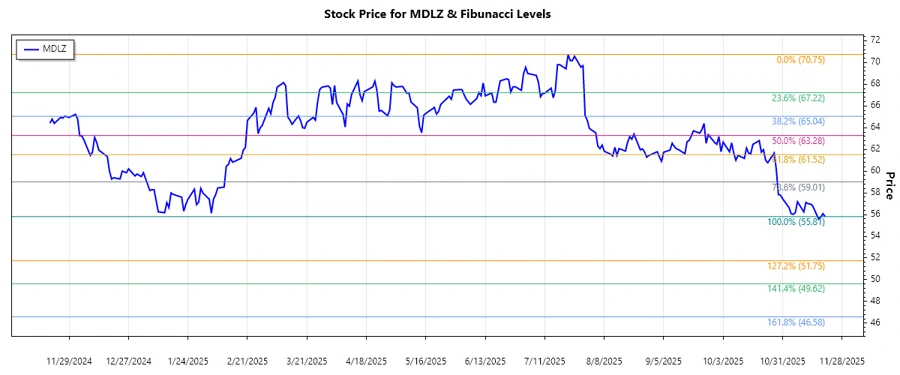
The Mondelēz International, Inc. stock has recently displayed a downward trend, reflecting some market pullback. With its diverse product portfolio and global presence, any price retracements could be viewed as potential buying opportunities, especially if the $55.81 level establishes itself as a solid support. Analysts should keep an eye on key levels to assess potential rebounds or further declines.
Fibonacci Analysis
| Description | Details |
|---|---|
| Trend Duration | 2024-12-02 to 2025-11-20 |
| High Point | $70.75 on 2025-07-22 |
| Low Point | $55.81 on 2025-11-20 |
| Fibonacci Level | Price Level |
|---|---|
| 0.236 | $59.13 |
| 0.382 | $61.09 |
| 0.5 | $63.28 |
| 0.618 | $65.47 |
| 0.786 | $68.20 |
The current price of $55.81 lies below the 0.236 Fibonacci retracement level, suggesting this could be a continuation of the downtrend with potential support likely around this level in the near future. Technically, if the price breaks below this support, further downside could be anticipated.
Conclusion
Mondelez International, Inc.'s stock's recent downtrend highlights some underlying market uncertainties. The Fibonacci retracement levels identify critical zones where potential price reversals could occur. While the stock trades below the crucial support level at 0.236, risks of further decrease remain. However, Mondelez's robust brand portfolio and market positioning may provide a cushion against short-term volatilities. Careful monitoring of related financial news and updates is advised to capture any emergent opportunities or assessment of evolving prospects.
Smart Data Insight
Master the Perfect Entry & Exit for this Stock
Don't leave your profits to chance. Historically, this stock follows specific seasonal patterns that institutional traders use to maximize returns.
- ✅ Identify the "Golden Buying Window"
- ✅ Avoid high-risk correction cycles
- ✅ Backtested data from the last 20+ years