September 14, 2025 a 10:15 am

MDLZ: Fibonacci Analysis - Mondelez International, Inc.
Mondelez International, Inc. (MDLZ) has shown consistent performance in the snack food and beverage sector globally. With a strong portfolio of brands like Oreo and Cadbury, Mondelez has managed to maintain steady revenue streams across various regions. Recent trends in the stock market indicate potential strategic adjustments in their global operations, warranting a closer look through technical analysis.
Fibonacci Analysis
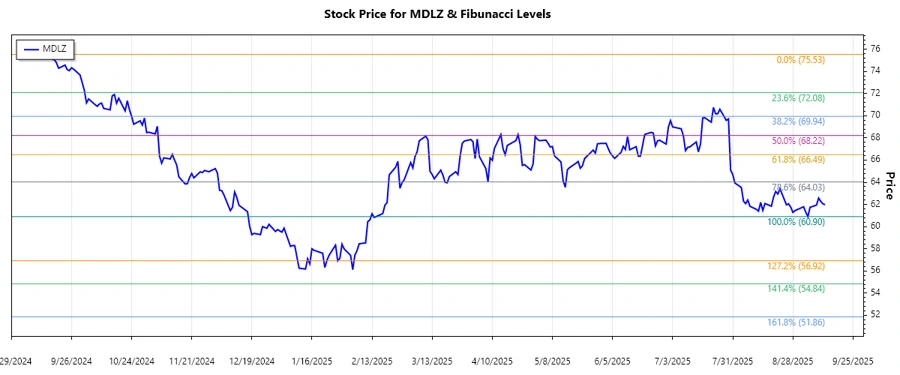
The period evaluated shows a dominant downtrend in the stock of Mondelez International, Inc. The financial data concludes as follows:
| Aspect | Details |
|---|---|
| Start Date of Trend | 2024-09-16 |
| End Date of Trend | 2025-09-12 |
| High Point (Price & Date) | $75.53 on 2024-09-16 |
| Low Point (Price & Date) | $60.9 on 2025-09-04 |
| Current Price (2025-09-12) | $61.98 |
Fibonacci Retracement Levels:
| Level | Price |
|---|---|
| 0.236 | $64.43 |
| 0.382 | $66.16 |
| 0.5 | $68.22 |
| 0.618 | $70.28 |
| 0.786 | $73.17 |
Assessment: The current price indicates it is not within the primary retracement levels, suggesting it may have found initial support, yet it's below 0.236 level.
Technically, this indicates a potential for further testing of support, with $64.43 acting as resistance if the stock attempts a recovery.
Conclusion
Mondelez International, Inc. faces potential headwinds in breaking through the aforementioned Fibonacci levels. While the company's diverse product lines offer resilience, the downtrend has underscored investor caution. Analysts are keen to see if Mondelez can maintain momentum in new markets and how cost management will affect margins in upcoming quarters. Risk lies in not overcoming key resistances, while the opportunity exists in leveraging global demand for its sustained growth.
Smart Data Insight
Master the Perfect Entry & Exit for this Stock
Don't leave your profits to chance. Historically, this stock follows specific seasonal patterns that institutional traders use to maximize returns.
- ✅ Identify the "Golden Buying Window"
- ✅ Avoid high-risk correction cycles
- ✅ Backtested data from the last 20+ years