May 24, 2026 a 07:46 am
![[Mondelez International, Inc.]](./n//MDLZdpdp-Dividend-Analysis-minmin-Mondelez-International-Inc-at-date-2026-05-24/images/image1.webp)
MDLZ: Dividend Analysis - Mondelez International, Inc.
📊 Mondelez International, Inc. (MDLZ) exhibits a robust dividend profile with a consistent 26-year dividend payment history. The company's commitment to shareholders is evident through its established practice of regular dividend payouts. Despite high payout ratios, the firm balances its dividend yield against market averages, offering a stable income source for investors. Their strategic management of free cash flows reinforces their credibility in maintaining and possibly increasing dividend payments over time.
Overview
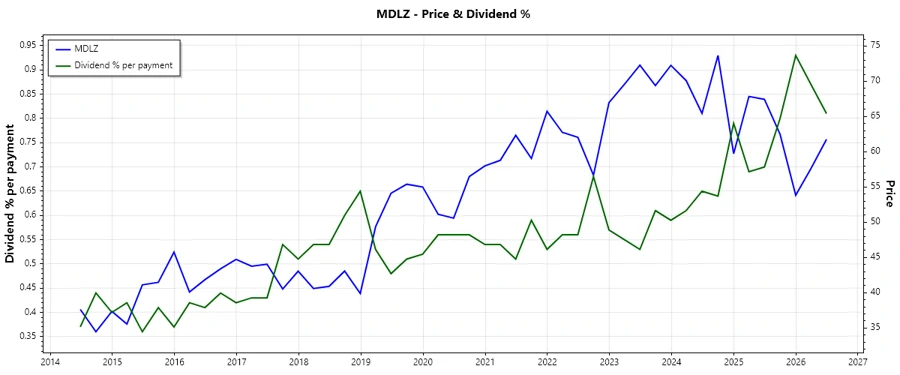
🗣️ Mondelez International operates within the Consumer Staples sector, a typically reliable industry for dividend investors due to its resilience in varying economic climates. The company's dividend yield stands at 3.24%, with a current dividend per share of $1.92. With 26 years of dividend history and no recent cuts or suspensions, their reliability as a dividend payer is demonstrated.
| Detail | Value |
|---|---|
| Sector | Consumer Staples |
| Dividend Yield | 3.24 % |
| Current Dividend Per Share | $1.92 |
| Dividend History | 26 years |
| Last Cut or Suspension | None |
Dividend History
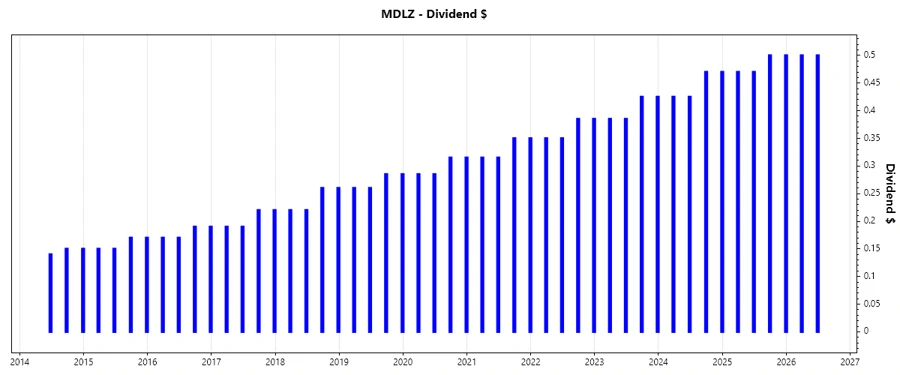
📈 Understanding a company’s dividend history offers insight into its commitment to shareholders as well as its financial stability. Mondelez has demonstrated a consistent ability to either maintain or increase payouts, with only one notable reduction in recent history. Such stability is crucial for income-focused investors.
| Year | Dividend per Share (USD) |
|---|---|
| 2026 | $1.00 |
| 2025 | $1.94 |
| 2024 | $1.79 |
| 2023 | $1.62 |
| 2022 | $1.47 |
Dividend Growth
📉 Dividend growth is a critical indicator of a company's ability to increase shareholder wealth. Over the past three years, the dividend growth rate averaged 9.69%, and over five years, 10.08%. While these figures indicate moderate growth, they also showcase a trend of steady enhancements in shareholder returns.
| Time | Growth |
|---|---|
| 3 years | 9.69 % |
| 5 years | 10.08 % |
The average dividend growth is 10.08% over 5 years. This shows moderate but steady dividend growth, potentially enriching investors as long-term stock holders.
Payout Ratio
✅ The payout ratio gives insight into sustainability of dividend payments. High payout ratios suggest potential risk in dividend sustainability if earnings were to decrease. Mondelez's current EPS-based payout ratio is 94.85%, and the FCF-based ratio is 95.81%. These high figures indicate that almost all earnings go to dividends, which could be a concern if income levels aren't stable.
| Key Figure | Ratio |
|---|---|
| EPS-based | 94.85 % |
| Free Cash Flow-based | 95.81 % |
Cashflow & Capital Efficiency
⚠️ The analysis of cash flow metrics shows how a company manages its financial resources. Free cash flow yield and earnings yield suggest efficiency; however, balances in cash flows are pivotal for operational agility.
| 2025 | 2024 | 2023 | |
|---|---|---|---|
| Free Cash Flow Yield | 4.64% | 4.40% | 3.65% |
| Earnings Yield | 3.52% | 5.76% | 5.02% |
| CAPEX to Operating Cash Flow | 28.33% | 28.25% | 23.59% |
| Stock-based Compensation to Revenue | 0.30% | 0.40% | 0.41% |
| Free Cash Flow / Operating Cash Flow Ratio | 71.67% | 71.75% | 76.41% |
Balance Sheet & Leverage Analysis
📊 Analyzing leverage ratios helps understand the company's capital structure. Mondelez shows a reliance on debt which means higher financial risk if not managed prudently.
| 2025 | 2024 | 2023 | |
|---|---|---|---|
| Debt-to-Equity | 0.87 | 0.68 | 0.70 |
| Debt-to-Assets | 0.31 | 0.27 | 0.28 |
| Debt-to-Capital | 0.46 | 0.41 | 0.41 |
| Net Debt to EBITDA | 4.36 | 2.11 | 2.37 |
| Current Ratio | 0.59 | 0.68 | 0.62 |
| Quick Ratio | 0.39 | 0.48 | 0.43 |
| Financial Leverage | 2.77 | 2.54 | 2.52 |
Fundamental Strength & Profitability
📈 The assessment of profitability ratios shows how efficiently assets are used to generate earnings. Mondelez’s margins demonstrate its operational efficiency and pricing power within the market.
| 2025 | 2024 | 2023 | |
|---|---|---|---|
| Return on Equity | 9.49% | 17.12% | 17.50% |
| Return on Assets | 3.43% | 6.73% | 6.95% |
| Net Margin | 6.36% | 12.65% | 13.77% |
| EBIT Margin | 8.55% | 18.58% | 17.85% |
| EBITDA Margin | 12.08% | 22.15% | 21.23% |
| Gross Margin | 28.01% | 39.12% | 38.22% |
| Research & Development to Revenue | 0% | 0% | 0% |
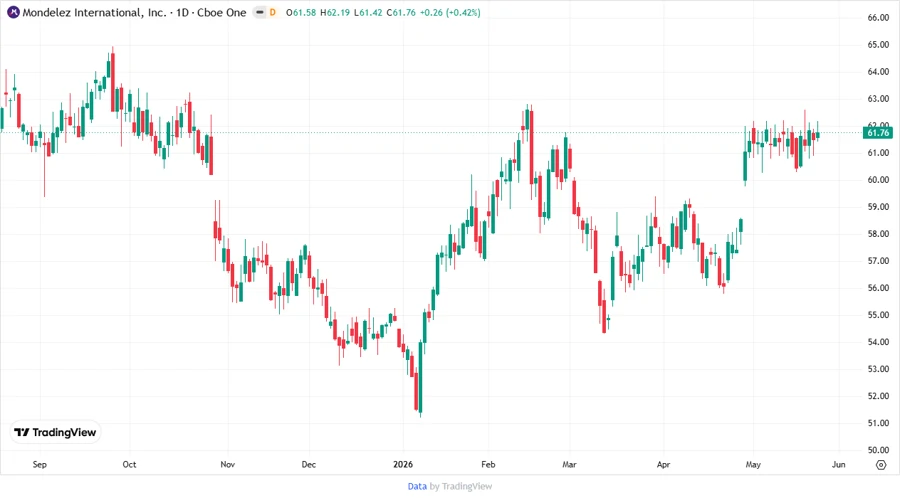
Price Development
Dividend Scoring System
| Criterion | Score | Scale |
|---|---|---|
| Dividend Yield | 3 | |
| Dividend Stability | 4 | |
| Dividend Growth | 3 | |
| Payout Ratio | 3 | |
| Financial Stability | 4 | |
| Dividend Continuity | 5 | |
| Cashflow Coverage | 4 | |
| Balance Sheet Quality | 3 |
Total Score: 29/40
Rating
🗣️ In conclusion, Mondelez International, Inc. offers a reliable investment for dividend-focused portfolios due to its continuous dividend history, moderate growth, and stable financial fundamentals. While payout ratios remain high, its strategic financial management and market positioning in the consumer staples sector support a positive outlook. Investors may find MDLZ a relatively safe choice with potential for moderate long-term capital growth.
Smart Data Insight
Master the Perfect Entry & Exit for this Stock
Don't leave your profits to chance. Historically, this stock follows specific seasonal patterns that institutional traders use to maximize returns.
- ✅ Identify the "Golden Buying Window"
- ✅ Avoid high-risk correction cycles
- ✅ Backtested data from the last 20+ years