August 10, 2025 a 02:47 am


MDLZ: Dividend Analysis - Mondelez International, Inc.
Mondelez International, Inc. is a stalwart in the consumer staples sector, renowned for its steadfast commitment to dividend distribution over the years. With a dividend history spanning 25 years without any cuts or suspensions, Mondelez offers a reassuring profile for investors seeking consistent income. The yield stands at a competitive 3.09%, while recent performance indicators suggest potential growth, painting a promising picture for prospective and current shareholders alike. Investment in Mondelez not only promises returns but also underscores stability in the turbulent stock market landscape.
📊 Overview
| Metric | Detail |
|---|---|
| Sector | Consumer Staples |
| Dividend Yield | 3.09% |
| Current Dividend per Share | 1.75 USD |
| Dividend History | 25 Years |
| Last Cut or Suspension | None |
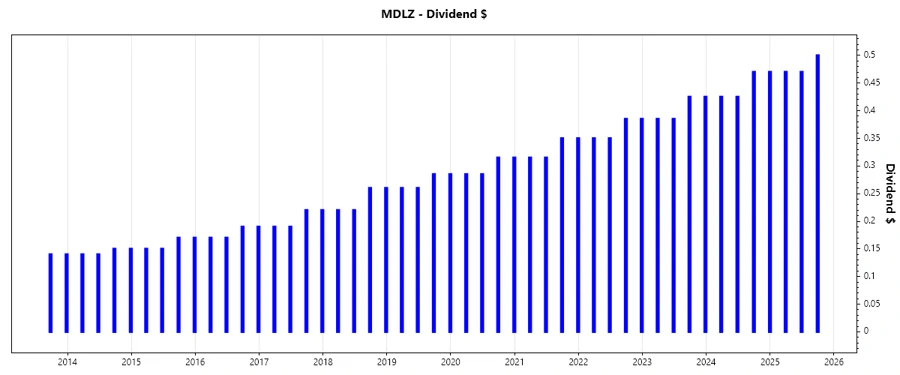
🗣️ Dividend History
The consistency of Mondelez's dividend payments highlights its robust business model and commitment to rewarding shareholders. This is a critical measure for evaluating the defensive attributes of the stock, especially in uncertain economic times.
| Year | Dividend per Share (USD) |
|---|---|
| 2025 | 1.44 |
| 2024 | 1.79 |
| 2023 | 1.62 |
| 2022 | 1.47 |
| 2021 | 1.33 |
📈 Dividend Growth
Over the past few years, Mondelez has shown a steady dividend growth, reflecting its financial strength and strategic capital allocation. This growth is pivotal for long-term investors who seek to hedge against inflation and grow their investment income.
| Time | Growth |
|---|---|
| 3 years | 10.41% |
| 5 years | 10.43% |
The average dividend growth is 10.43% over 5 years. This shows moderate but steady dividend growth.
✅ Payout Ratio
The payout ratio is a crucial factor in assessing the sustainability of a company's dividend payments. A balanced payout ratio indicates a company’s ability to maintain its dividend payments even in fluctuating economic conditions.
| Key Figure | Ratio |
|---|---|
| EPS-Based | 63.80% |
| Free Cash Flow-Based | 79.22% |
The EPS payout ratio of 63.80% is relatively balanced, suggesting that Mondelez can comfortably cover its dividend payments from its earnings. However, the FCF payout ratio at 79.22% is higher, indicating a tighter coverage, though it remains within a reasonable range for a stable company like Mondelez.
💰 Cashflow & Capital Efficiency
Examining cash flow metrics provides insight into the operational efficiency and financial stability of a company. Robust cash flow ensures a company's ability to sustain dividends and manage its capital needs effectively.
| Metric | 2024 | 2023 | 2022 |
|---|---|---|---|
| Free Cash Flow Yield | 4.40% | 3.65% | 3.27% |
| Earnings Yield | 5.76% | 5.02% | 2.96% |
| CAPEX to Operating Cash Flow | 28.25% | 23.59% | 23.18% |
| Stock-based Compensation to Revenue | 0.40% | 0.41% | 0.38% |
| Free Cash Flow / Operating Cash Flow Ratio | 71.75% | 76.41% | 76.82% |
The cash flow metrics illustrate a solid foundation with consistent free cash flow generation, although with some variation in earnings yield across the years. The efficient capital expenditure management also highlights Mondelez's efficiency in investing back into its growth.
💼 Balance Sheet & Leverage Analysis
The balance sheet metrics focus on the financial stability and leverage situation of Mondelez. These indicators help assess the company’s ability to manage and service its debt, crucial for long-term solvency and operational resilience.
| Metric | 2024 | 2023 | 2022 |
|---|---|---|---|
| Debt-to-Equity | 68.22% | 70.40% | 87.57% |
| Debt-to-Assets | 26.82% | 27.94% | 33.08% |
| Debt-to-Capital | 40.55% | 41.31% | 46.69% |
| Net Debt to EBITDA | 2.11 | 2.37 | 4.54 |
| Current Ratio | 0.68 | 0.62 | 0.60 |
| Quick Ratio | 0.48 | 0.43 | 0.40 |
| Financial Leverage | 2.54 | 2.52 | 2.65 |
The debt-to-equity and debt-to-capital ratios show improving leverage, suggesting Mondelez is gradually reducing its dependency on debt for financing. This reduction enhances the firm's financial flexibility, which is vital during economic downturns.
📉 Fundamental Strength & Profitability
This section covers key profitability ratios that showcase the effective utilization of equity, assets, and invested capital. Profit margins provide insights into operational efficiency and cost management.
| Metric | 2024 | 2023 | 2022 |
|---|---|---|---|
| Return on Equity | 17.12% | 17.50% | 10.11% |
| Return on Assets | 6.73% | 6.95% | 3.82% |
| Net Margin | 12.65% | 13.77% | 8.63% |
| EBIT Margin | 18.58% | 17.85% | 11.61% |
| EBITDA Margin | 22.15% | 21.23% | 15.12% |
| Gross Margin | 39.12% | 38.22% | 35.92% |
| R&D to Revenue | 0% | 0% | 0% |
Mondelez demonstrates robust profitability with increasing ROE and ROA reflecting an effective deployment of equity and assets respectively. Maintaining high gross and EBIT margins also signifies constructive control over cost structures.
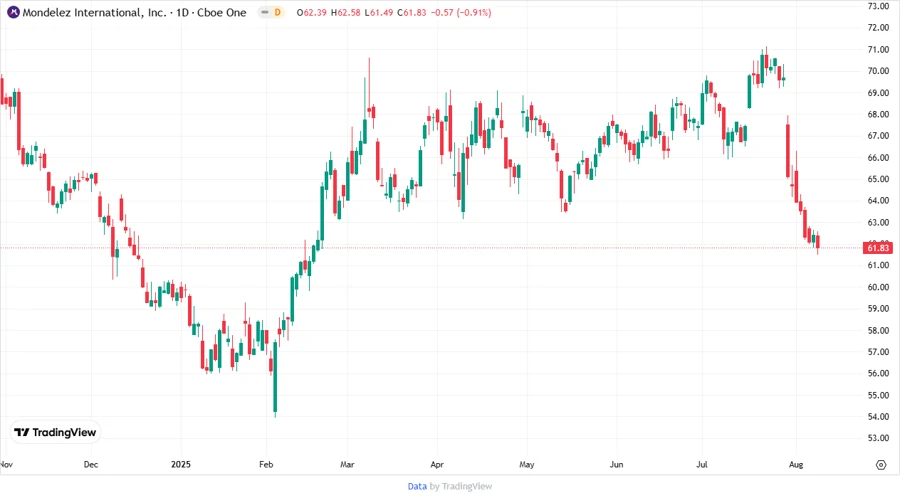
📊 Price Development
✅ Dividend Scoring System
Our dividend scoring system evaluates key facets of dividend and financial health, offering a holistic assessment of investment potential.
| Criteria | Score | Bar |
|---|---|---|
| Dividend Yield | 3 | |
| Dividend Stability | 4 | |
| Dividend Growth | 3 | |
| Payout Ratio | 3 | |
| Financial Stability | 4 | |
| Dividend Continuity | 5 | |
| Cashflow Coverage | 4 | |
| Balance Sheet Quality | 3 |
Total Score: 29/40
⭐ Rating
In summary, Mondelez International, Inc. is a compelling investment for income-focused investors due to its solid dividend history and potential for moderate growth. With a strong balance sheet and adept management of cash flows, the company presents a viable investment avenue with reliable returns, albeit with moderate leverage metrics to keep in check.
Smart Data Insight
Master the Perfect Entry & Exit for this Stock
Don't leave your profits to chance. Historically, this stock follows specific seasonal patterns that institutional traders use to maximize returns.
- ✅ Identify the "Golden Buying Window"
- ✅ Avoid high-risk correction cycles
- ✅ Backtested data from the last 20+ years