November 14, 2025 a 09:03 am
MCO: Trend and Support & Resistance Analysis - Moody's Corporation
The stock of Moody's Corporation shows a complex trend with moderate fluctuations over the last several months. Recently, the stock price presents signs of stabilization after experiencing both upward and downward pressure. Investors should monitor short-term volatility while considering long-term strategic positions given the company's solid market presence and diverse offerings in credit ratings and analytics.
Trend Analysis
| Date | Closing Price | Trend |
|---|---|---|
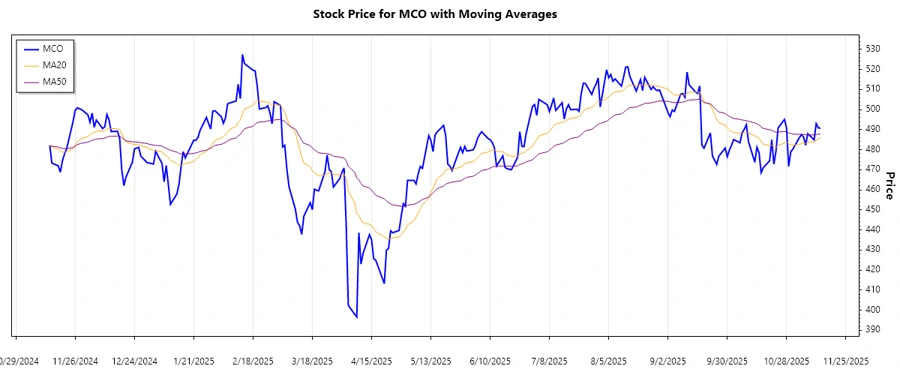
| 2025-11-13 | 490.77 | ▲ |
| 2025-11-12 | 490.84 | ▼ |
| 2025-11-11 | 493.00 | ▲ |
| 2025-11-10 | 484.93 | ▼ |
| 2025-11-07 | 487.98 | ▲ |
| 2025-11-06 | 482.21 | ▶ |
| 2025-11-05 | 486.46 | ▲ |
The EMA20 is currently above the EMA50, indicating a prevailing upward trend in the short to medium term. However, the proximity suggests potential for reversals or consolidation phases. This necessitates caution as well as opportunity for strategic entry points.
Support- and Resistance
| Zone Type | From | To |
|---|---|---|
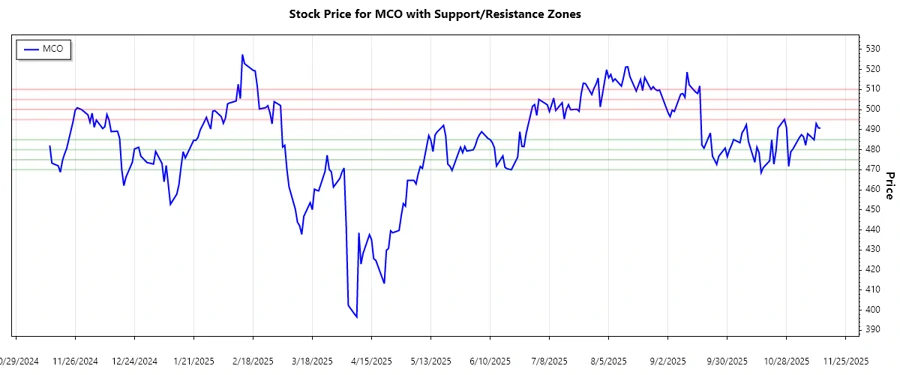
| Support Zone 1 | 480.00 | 485.00 |
| Support Zone 2 | 470.00 | 475.00 |
| Resistance Zone 1 | 495.00 | 500.00 |
| Resistance Zone 2 | 505.00 | 510.00 |
Currently, the stock price is close to the lower end of the initial resistance zone, suggesting the potential for a breakout or retraction based on market dynamics. Market participants should watch for volume confirmations that could indicate a directional move.
Conclusion
The current market structure for Moody's Corporation reflects a nuanced uptrend, providing optimism for investors with a bullish outlook. Key risks involve potential volatility within specified support and resistance thresholds, which could impede sustained momentum. The EMA analysis implicates a potential for continuance in the upward trend, albeit less pronounced than previous cycles. Analysts must keep an eye on global economic factors which might influence credit markets, affecting Moody's core business sectors. As always, diversification and risk management remain key amid varied external market conditions.
Smart Data Insight
Master the Perfect Entry & Exit for this Stock
Don't leave your profits to chance. Historically, this stock follows specific seasonal patterns that institutional traders use to maximize returns.
- ✅ Identify the "Golden Buying Window"
- ✅ Avoid high-risk correction cycles
- ✅ Backtested data from the last 20+ years