September 22, 2025 a 04:03 am
MCO: Trend and Support & Resistance Analysis - Moody's Corporation
Moody's Corporation is a significant player in the financial sector, specializing in risk assessment and analytics. Recent technical analysis indicates notable movements in its stock trends. By evaluating both trend and support & resistance levels, investors can better understand the potential for trading opportunities or risks.
Trend Analysis
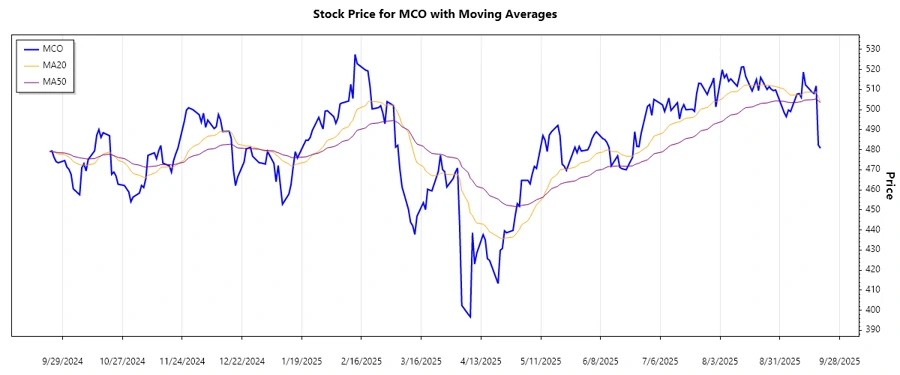
The analysis of Moody's Corporation stock over the recent period reveals fluctuations primarily characterized by a mix of trends. By calculating exponential moving averages (EMA), namely EMA20 and EMA50, recent days indicate fluctuating movements where EMA20 temporarily crosses EMA50, hinting at potential directional changes. Let's review the trend based on closing prices.
| Date | Close Price ($) | Trend |
|---|---|---|
| 2025-09-19 | 480.74 | ⚖️ |
| 2025-09-18 | 482.32 | ⚖️ |
| 2025-09-17 | 511.77 | ▲ |
| 2025-09-16 | 508.00 | ▲ |
| 2025-09-15 | 508.76 | ▲ |
| 2025-09-12 | 512.31 | ▲ |
| 2025-09-11 | 518.70 | ▲ |
The recent trend interpretation reveals an emerging upward movement, suggesting investor confidence in the stock. Such trends often indicate favorable conditions for potential growth.
Support and Resistance
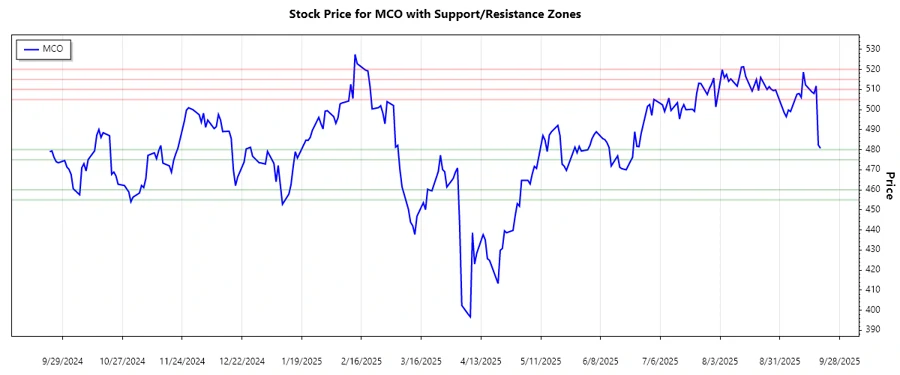
Based on technical analysis, Moody's Corporation exhibits distinct support and resistance zones, offering traders insights for strategic entry and exit points. Identification of these zones can suggest whether the current position of the stock aligns with these technical benchmarks.
| Zone Type | From ($) | To ($) |
|---|---|---|
| Support | 475 | 480 |
| Support | 455 | 460 |
| Resistance | 515 | 520 |
| Resistance | 505 | 510 |
The stock currently hovers around a defined resistance zone, showing potential for breakthroughs or reversals. Traders should monitor these levels closely for signs.
Conclusion
Moody's Corporation shows fluctuating performance with identified upward trends, confirming periodic investor optimism. Current positions relative to established resistance zones hint at potential shifts, revealing opportunities and risks in equal measure. Traders should consider these technical indicators, watching for breakthrough signals or reversals at critical levels. Overall, maintaining a vigilant observation of both trend dynamics and key price zones can better equip analysts in navigating MCO's market landscape.
JSON:
Smart Data Insight
Master the Perfect Entry & Exit for this Stock
Don't leave your profits to chance. Historically, this stock follows specific seasonal patterns that institutional traders use to maximize returns.
- ✅ Identify the "Golden Buying Window"
- ✅ Avoid high-risk correction cycles
- ✅ Backtested data from the last 20+ years