
July 05, 2026 a 11:30 am

MCO: Dividend Analysis - Moody's Corporation
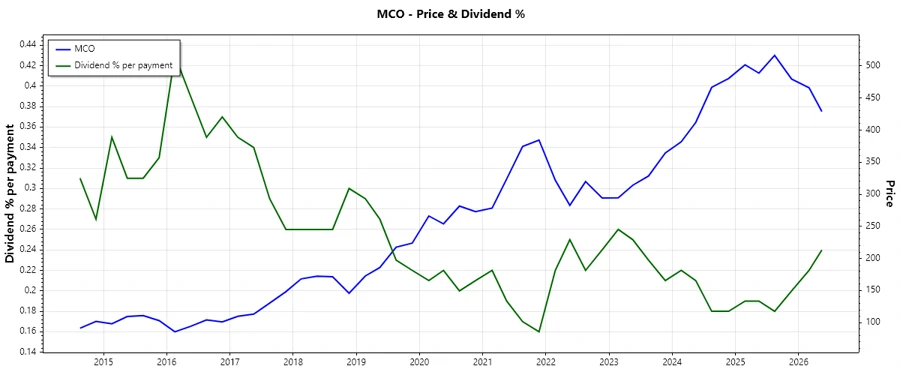
Moody's Corporation presents a striking combination of stability and modest income growth through dividends. With a solid dividend history, this company has consistently rewarded its investors. As the dividend yield sits below 1%, Moody’s focuses on capital appreciation. Its prudent payout ratios and strong financials suggest potential for sustainable increases in shareholder value.
📊 Overview
Moody's Corporation operates within the Financial Services sector, offering consistent dividends due to its robust business model. The dividend yield is currently 0.92%, signifying a reliable but modest return for income-focused investors. An extended dividend history of 33 years underlines the company's commitment to rewarding shareholders, with no recent cuts or suspensions observed.
| Attribute | Value |
|---|---|
| Sector | Financial Services |
| Dividend yield | 0.92% |
| Current dividend per share | $3.91 |
| Dividend history | 33 years |
| Last cut or suspension | None |
🗣️ Dividend History
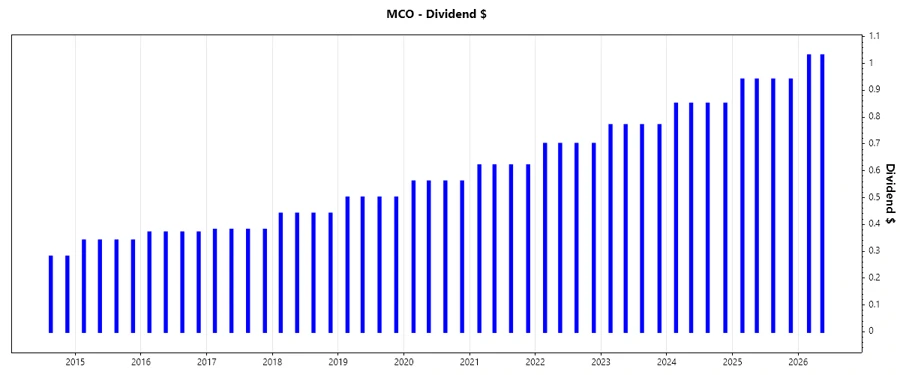
The long-standing history of dividends offered by Moody's serves as a testament to its resilient cash generation capabilities. Investors looking for steady income can take comfort in this impressive track record. The historical dividend stability supports investor confidence.
| Year | Dividend per Share (USD) |
|---|---|
| 2026 | 2.06 |
| 2025 | 3.76 |
| 2024 | 3.40 |
| 2023 | 3.08 |
| 2022 | 2.80 |
📈 Dividend Growth
Observing the growth of dividends over recent years highlights Moody's capability to incrementally enhance shareholder income despite varying economic conditions. This is crucial for long-term dividend investors seeking not only stable payouts but also growth to outpace inflation.
| Time | Growth |
|---|---|
| 3 years | 10.33% |
| 5 years | 10.91% |
The average dividend growth is 10.91% over 5 years. This demonstrates moderate but steady dividend growth, indicating robust operational performance.
⚖️ Payout Ratio
Payout ratios are critical for assessing the sustainability of dividend distributions. Moody's combines a prudent approach with excellent payout ratios, suggesting dividends are well-covered by both earnings and free cash flow.
| Key figure | Ratio |
|---|---|
| EPS-based | 27.73% |
| Free cash flow-based | 22.85% |
The EPS payout ratio of 27.73% and FCF payout ratio of 22.85% indicate a conservative payout policy, allowing for potential reinvestment in growth and maintaining a buffer against earnings volatility.
💸 Cashflow & Capital Efficiency
A strong free cash flow yield and efficient capital spending demonstrate Moody's ability to reinvest and distribute dividends seamlessly. The company’s management of operating cash flows supports its ongoing dividend strategy.
| Metric | 2025 | 2024 | 2023 |
|---|---|---|---|
| Free Cash Flow Yield | 2.81% | 2.93% | 2.63% |
| Earnings Yield | 2.69% | 2.39% | 2.25% |
| CAPEX to Operating Cash Flow | 11.24% | 11.17% | 12.60% |
| Stock-based Compensation to Revenue | 3.00% | 0% | 0% |
| Free Cash Flow / Operating Cash Flow Ratio | 88.76% | 88.83% | 87.40% |
The stable cash flow stability reflects efficient capital allocation and solid investment approaches, vital for sustained shareholder distributions and business growth.
🏢 Balance Sheet & Leverage Analysis
Analyzing leverage and liquidity ratios is essential for assessing Moody's ability to meet its financial obligations. A moderately high debt-to-equity ratio is balanced by strong interest coverage and liquidity metrics.
| Metric | 2025 | 2024 | 2023 |
|---|---|---|---|
| Debt-to-Equity | 1.81 | 2.17 | 2.23 |
| Net Debt to EBITDA | 1.26 | 1.60 | 2.10 |
| Current Ratio | 1.74 | 1.43 | 1.69 |
| Quick Ratio | 1.74 | 1.43 | 1.69 |
| Financial Leverage | 3.90 | 4.34 | 4.40 |
The structure indicates Moody's is well-positioned to manage its debt and liquidity, ensuring operational continuity and dividend sustainability.
📈 Fundamental Strength & Profitability
Profitability metrics such as ROE and margins reveal Moody's operational efficiency and capacity to generate returns on investments. Consistently high ROE signifies superior management effectiveness in utilizing assets for income generation.
| Metric | 2025 | 2024 | 2023 |
|---|---|---|---|
| Return on Equity | 60.66% | 57.73% | 48.43% |
| Net Profit Margin | 31.86% | 29.03% | 27.16% |
| EBIT Margin | 44.77% | 40.95% | 36.21% |
| EBITDA Margin | 50.98% | 47.04% | 42.51% |
| Research & Development to Revenue | 0% | 0% | 0% |
Continuous high performance in profitability metrics underlines Moody's position in the market and capability to maintain superior financial results.
📉 Price Development
💡 Dividend Scoring System
This scoring system evaluates Moody's performance across various dividend-related categories, reflecting its investment attractiveness for dividend-seeking investors.
| Criterion | Score | Score Bar |
|---|---|---|
| Dividend yield | 3 | |
| Dividend Stability | 5 | |
| Dividend growth | 4 | |
| Payout ratio | 5 | |
| Financial Stability | 4 | |
| Dividend Continuity | 5 | |
| Cashflow Coverage | 5 | |
| Balance Sheet Quality | 4 |
Total Score: 35/40
✅ Rating
Moody's Corporation represents a strong investment opportunity for dividend-focused investors seeking stability and growth in income. With solid financials, an impressive dividend history, and a comprehensive management strategy, Moody's is a reliable choice for long-term portfolios.
Smart Data Insight
Master the Perfect Entry & Exit for this Stock
Don't leave your profits to chance. Historically, this stock follows specific seasonal patterns that institutional traders use to maximize returns.
- ✅ Identify the "Golden Buying Window"
- ✅ Avoid high-risk correction cycles
- ✅ Backtested data from the last 20+ years