
May 04, 2026 a 02:46 am

MCO: Dividend Analysis - Moody's Corporation
Moody's Corporation, a stalwart in the financial services sector, showcases a resilient dividend profile with a steady history and moderate growth trends. Despite a modest dividend yield, Moody's strong financial fundamentals and intelligent payout strategies have sustained investor interest. The company's consistent dividend history, exemplified by over three decades without cuts, underscores its reliability as a dividend payer.
📊 Overview
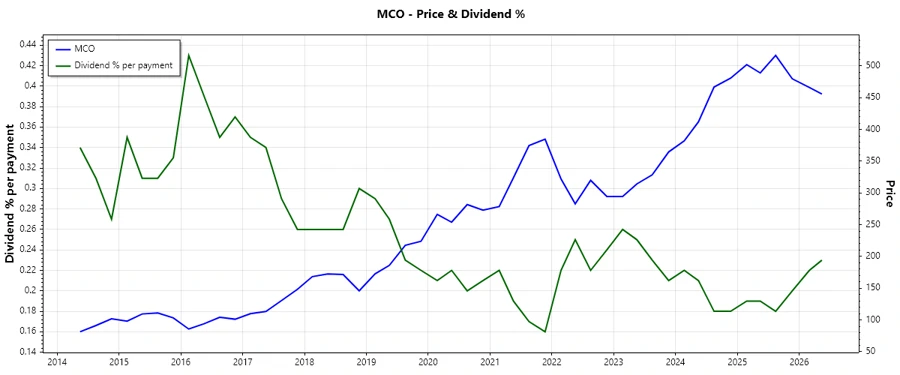
Moody's Corporation is notable for its dedication to shareholders, with an impressive dividend history stretching 33 years without suspension or cuts. This track record, coupled with a sensible dividend yield of 0.86%, aligns with its sector benchmark. The current dividend per share is $3.91, reflecting prudent financial governance and strategic payout decisions designed to maintain shareholder value.
| Metric | Value |
|---|---|
| Sector | Financial Services |
| Dividend yield | 0.86% |
| Current dividend per share | 3.91 USD |
| Dividend history | 33 years |
| Last cut or suspension | None |
🗣️ Dividend History
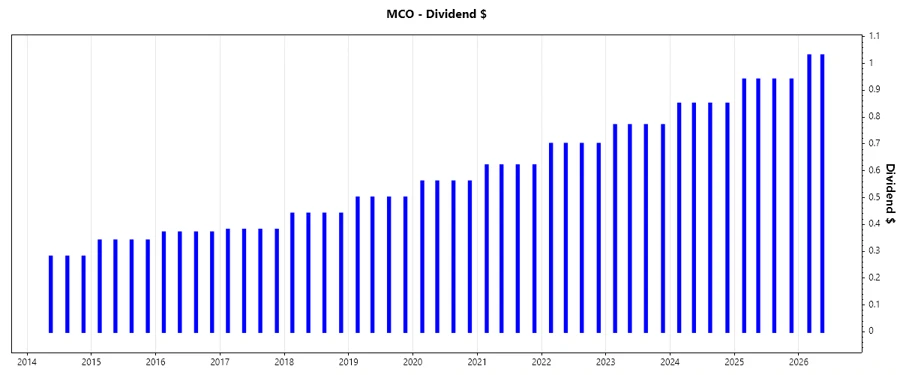
With over 33 years of uninterrupted dividends, Moody's Corporation emphasizes long-term value creation and financial sustainability. Its dividend history highlights the firm's robustness even in volatile market conditions, providing investors with a reliable source of income.
| Year | Dividend per Share (USD) |
|---|---|
| 2026 | 2.06 |
| 2025 | 3.76 |
| 2024 | 3.40 |
| 2023 | 3.08 |
| 2022 | 2.80 |
📈 Dividend Growth
Moody's dividend growth rate of 10.32% over 3 years and 10.91% over 5 years indicates a healthy upward trend. This consistent growth in dividends is pivotal for long-term investors seeking enhanced value and reliable income streams from their investments in Moody's Corporation.
| Time | Growth |
|---|---|
| 3 years | 10.32% |
| 5 years | 10.91% |
The average dividend growth is 10.91% over 5 years. This shows moderate but steady dividend growth.
✅ Payout Ratio
The payout ratio is a determinant of a company's ability to sustain its dividends. Moody's EPS-based payout ratio of 27.74% and a free cash flow-based ratio of 22.85% imply ample room for future dividend growth without compromising financial stability.
| Key figure | Ratio |
|---|---|
| EPS-based | 27.74% |
| Free cash flow-based | 22.85% |
The EPS-based payout ratio of 27.74% and the FCF-based payout ratio of 22.85% demonstrate a judicious approach to dividends, ensuring sustainability and room for targeted growth.
💰 Cashflow & Capital Efficiency
Effective cash flow management and capital utilization are critical for sustained dividend payments. Moody's showcases solid free cash flow generation and prudent capital allocation, essential for ensuring the availability of funds for dividend disbursements while pursuing growth opportunities.
| Year | 2023 | 2024 | 2025 |
|---|---|---|---|
| Free Cash Flow Yield | 2.63% | 2.93% | 2.81% |
| Earnings Yield | 2.25% | 2.39% | 2.69% |
| CAPEX to Operating Cash Flow | 12.60% | 11.17% | 11.24% |
| Stock-based Compensation to Revenue | N/A | N/A | 3.01% |
| Free Cash Flow / Operating Cash Flow Ratio | 87.40% | 88.33% | 88.76% |
Moody's capital efficiency, measured by its ability to reinvest in growth while maintaining dividend levels, supports its long-term objectives of financial stability and investor satisfaction.
📉 Balance Sheet & Leverage Analysis
A robust balance sheet with controlled leverage ratios assists in maintaining dividend reliability. It highlights the firm's capability to meet short-term obligations while leveraging assets for growth, ensuring a stable financial foundation for continued dividend distributions.
| Year | 2023 | 2024 | 2025 |
|---|---|---|---|
| Debt-to-Equity | 223.48% | 217.28% | 181.33% |
| Debt-to-Assets | 50.71% | 49.96% | 46.44% |
| Debt-to-Capital | 69.09% | 68.48% | 64.45% |
| Net Debt to EBITDA | 2.10x | 1.60x | 1.26x |
| Current Ratio | 1.69 | 1.43 | 1.74 |
| Quick Ratio | 1.69 | 1.43 | 1.74 |
| Financial Leverage | 4.41x | 4.35x | 3.90x |
Maintaining an optimal balance between leverage and cash flow is crucial for the company's strategic growth without compromising its dividend policy.
💪 Fundamental Strength & Profitability
Moody's robust return metrics demonstrate its ability to convert its resources into revenue and profit, highlighting earnings quality and predictive ability to sustain robust dividend distributions. These factors bolster investor confidence in Moody's consistent dividend policies.
| Year | 2023 | 2024 | 2025 |
|---|---|---|---|
| Return on Equity | 48.43% | 57.73% | 60.66% |
| Return on Assets | 10.99% | 13.27% | 15.53% |
| Margins: Net | 27.16% | 29.03% | 31.86% |
| EBIT | 36.21% | 40.96% | 44.77% |
| EBITDA | 42.51% | 47.03% | 50.98% |
| Gross | 65.15% | 66.41% | 68.15% |
| Research & Development to Revenue | N/A | N/A | N/A |
The profitability and margin metrics are strong indicators of Moody's ability to generate substantial returns on equity and assets, crucial for dividend sustainability.
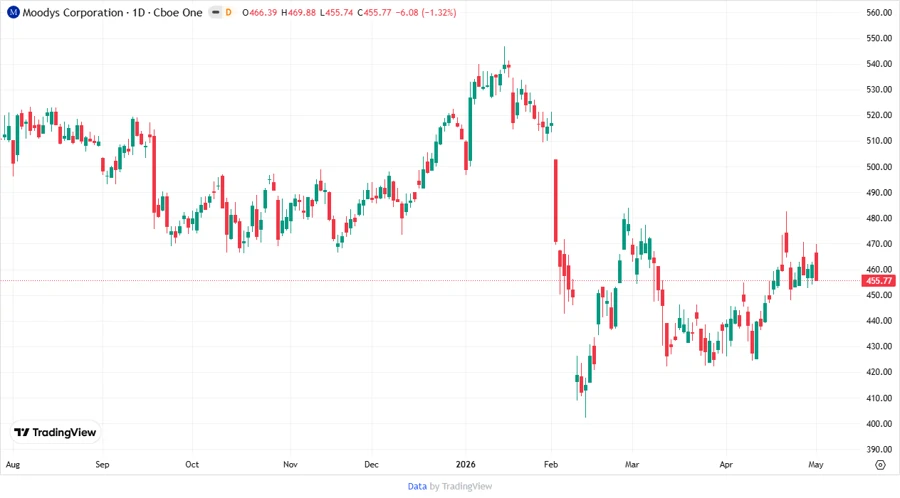
Price Development
🌟 Dividend Scoring System
| Category | Score | Score Bar |
|---|---|---|
| Dividend yield | 3 | |
| Dividend Stability | 5 | |
| Dividend growth | 4 | |
| Payout ratio | 4 | |
| Financial stability | 4 | |
| Dividend continuity | 5 | |
| Cashflow Coverage | 4 | |
| Balance Sheet Quality | 4 |
Overall Score: 33/40
🗳️ Rating
Moody's Corporation is a compelling choice for dividend-focused investors seeking consistency and moderate growth. With a solid financial foundation, steady dividend history, and strategic payout practices, it offers a reliable source of investment income. This makes it an excellent holding for those prioritizing income stability and financial prudence.
Smart Data Insight
Master the Perfect Entry & Exit for this Stock
Don't leave your profits to chance. Historically, this stock follows specific seasonal patterns that institutional traders use to maximize returns.
- ✅ Identify the "Golden Buying Window"
- ✅ Avoid high-risk correction cycles
- ✅ Backtested data from the last 20+ years