March 14, 2026 a 03:31 am

MCO: Dividend Analysis - Moody's Corporation
Moody's Corporation presents a compelling dividend profile characterized by stability, growth, and efficiency. The company has consistently maintained its dividend payout for over three decades without any cuts or suspensions, reflecting a solid history of shareholder returns. This analysis delves deeper into Moody's dividend metrics to assess its sustainability and growth prospects.
📊 Overview
Moody's Corporation operates within the financial services sector, offering its investors a modest dividend yield. Despite the modesty of the yield, its continuous growth over a significant period is noteworthy.
| Metric | Value |
|---|---|
| Sector | Financial Services |
| Dividend yield | 0.83% |
| Current dividend per share | 3.91 USD |
| Dividend history | 33 years |
| Last cut or suspension | None |
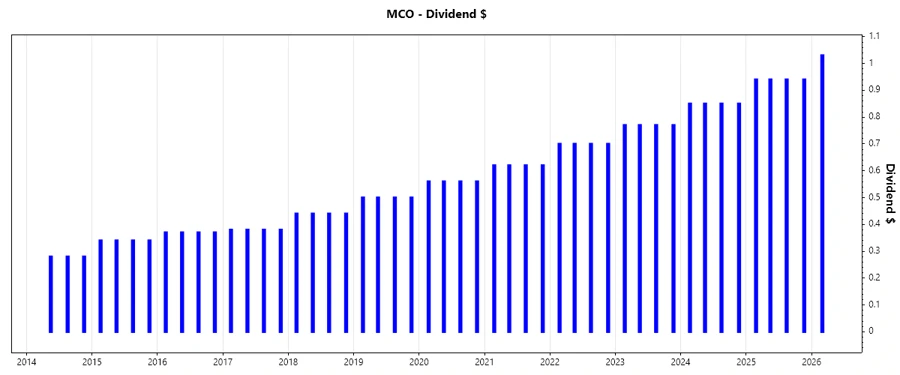
🗣️ Dividend History
Moody's stable dividend history of 33 years is a testament to its financial robustness, attracting investors who prioritize consistent income. This pictorial representation is crucial as it chronicles the consistency of dividend payments, underlining commitment to shareholder returns.
| Year | Dividend Per Share (USD) |
|---|---|
| 2026 | 1.03 |
| 2025 | 3.76 |
| 2024 | 3.40 |
| 2023 | 3.08 |
| 2022 | 2.80 |
📈 Dividend Growth
The steady growth in Moody's dividends reflects its operational success and efficient capital allocation. This growth perception is critical as it implies future potential for increased income streams to investors.
| Time | Growth |
|---|---|
| 3 years | 10.33% |
| 5 years | 10.91% |
The average dividend growth is 10.91% over 5 years. This shows moderate but steady dividend growth, signaling to investors a reliable income coupled with capital appreciation potential.
⚠️ Payout Ratio
The payout ratio is a key metric that indicates the sustainability of a company's dividend. A lower ratio suggests a greater margin of safety for the dividend.
| Key figure | Ratio |
|---|---|
| EPS-based | 28.32% |
| Free cash flow-based | 24.61% |
With an EPS payout ratio of 28.32% and a FCF payout ratio of 24.61%, Moody's maintains a conservative approach, underscoring its dividend's sustainability even in volatile economic conditions.
✅ Cashflow & Capital Efficiency
The analysis of cash flow metrics offers insights into Moody’s operational cash management and investment efficiency, which are critical for funding consistent dividends.
| Year | 2023 | 2024 | 2025 |
|---|---|---|---|
| Free Cash Flow Yield | 2.63% | 2.93% | 2.81% |
| Earnings Yield | 2.24% | 2.39% | 2.69% |
| CAPEX to Operating Cash Flow | 12.60% | 11.17% | 2.79% |
| Stock-based Compensation to Revenue | 0% | 0% | 3.00% |
| Free Cash Flow / Operating Cash Flow Ratio | 87.40% | 88.83% | 88.76% |
Moody’s exhibits strong free cash flow generation and efficient capital management, supporting sustainable dividend payments while maintaining operational flexibility for future growth.
📉 Balance Sheet & Leverage Analysis
A careful examination of leverage metrics provides an overview of Moody’s financial stability and risk exposure, essential in maintaining consistent dividends.
| Year | 2023 | 2024 | 2025 |
|---|---|---|---|
| Debt-to-Equity | 223.48% | 217.28% | 181.33% |
| Debt-to-Assets | 50.71% | 49.96% | 46.44% |
| Debt-to-Capital | 69.09% | 68.48% | 64.45% |
| Net Debt to EBITDA | 2.10 | 1.60 | 1.26 |
| Current Ratio | 1.69 | 1.43 | 1.74 |
| Quick Ratio | 1.69 | 1.43 | 1.74 |
| Financial Leverage | 4.41 | 4.35 | 3.90 |
Despite high leverage, Moody's remains solvent with ample interest coverage, managing its debt prudently to avoid compromising its dividend commitments.
🗣️ Fundamental Strength & Profitability
Evaluating key profitability ratios helps determine if Moody’s operational efficiency can sustain its dividend payments whilst driving shareholder value.
| Year | 2023 | 2024 | 2025 |
|---|---|---|---|
| Return on Equity | 48.43% | 57.73% | 60.66% |
| Return on Assets | 10.99% | 13.27% | 15.53% |
| Margins: Net | 27.16% | 29.03% | 31.86% |
| Margins: EBIT | 36.21% | 40.96% | 44.77% |
| Margins: EBITDA | 42.51% | 47.04% | 50.98% |
| Margins: Gross | 65.15% | 66.41% | 68.15% |
| Research & Development to Revenue | 0% | 0% | 0% |
Moody's demonstrates strong profitability metrics which are instrumental in maintaining and growing its dividend, with robust returns on equity and assets reflecting efficient profit generation.
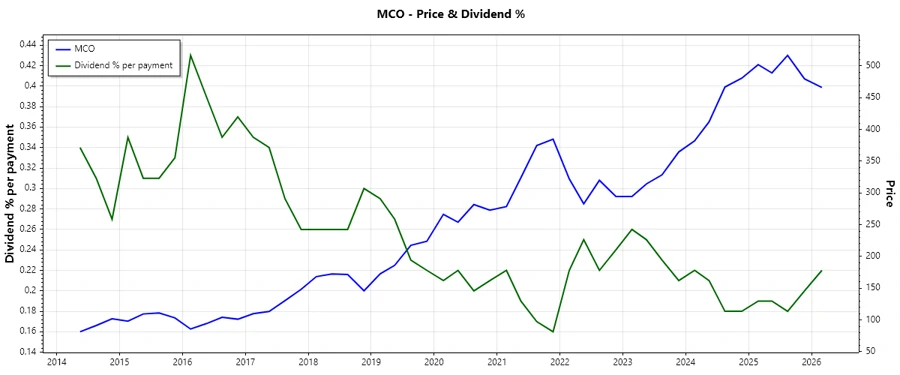
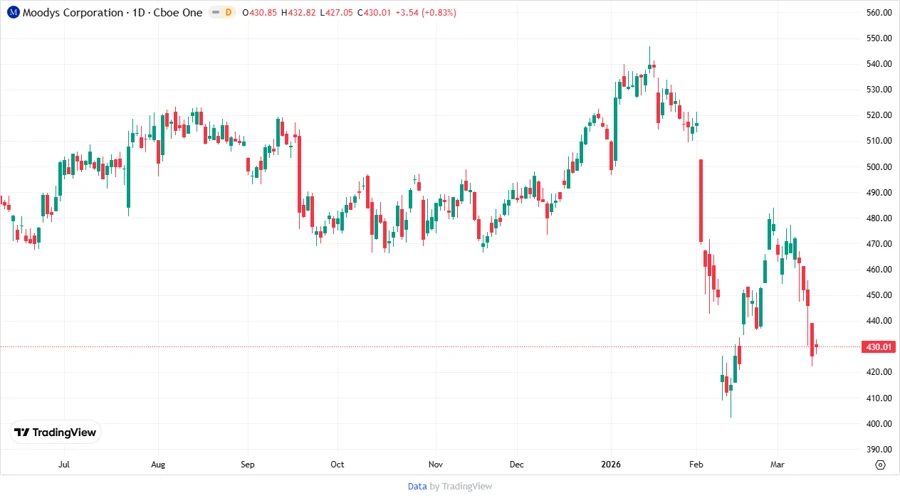
📈 Price Development
🗡️ Dividend Scoring System
| Category | Score | Graph |
|---|---|---|
| Dividend yield | 2 | |
| Dividend Stability | 5 | |
| Dividend growth | 4 | |
| Payout ratio | 4 | |
| Financial stability | 4 | |
| Dividend continuity | 5 | |
| Cashflow Coverage | 3 | |
| Balance Sheet Quality | 3 |
Overall Score: 30/40
🗣️ Rating
Moody's Corporation showcases a commendable dividend track record, balancing moderate yields with impressive stability and growth metrics. Despite its high leverage, the company's robust financial metrics and sound cash flow management underline its ability to support and possibly increase its dividend payouts. As such, it presents a reliable investment for dividend-focused portfolios, particularly for those seeking consistent income streams with potential capital appreciation.
Smart Data Insight
Master the Perfect Entry & Exit for this Stock
Don't leave your profits to chance. Historically, this stock follows specific seasonal patterns that institutional traders use to maximize returns.
- ✅ Identify the "Golden Buying Window"
- ✅ Avoid high-risk correction cycles
- ✅ Backtested data from the last 20+ years