January 08, 2026 a 03:31 pm

MCO: Dividend Analysis - Moody's Corporation
Moody's Corporation represents a stable dividend profile characterized by a low yield yet consistent payout history. The corporation excels in sustaining dividend growth, underlined by a steady increase in payouts over 26 years. The robust financial ratios further ensure continued dividend reliability.
📊 Overview
Moody's Corporation, operating within the financial sector, maintains a moderate dividend yield of 0.78%. With a current dividend per share of $3.41 and a commendable 26-year history of payouts without suspension, it demonstrates consistent growth and reliability.
| Key Metrics | Value |
|---|---|
| Sector | Financial |
| Dividend Yield | 0.78% |
| Current Dividend per Share | $3.41 USD |
| Dividend History | 26 years |
| Last Cut or Suspension | None |
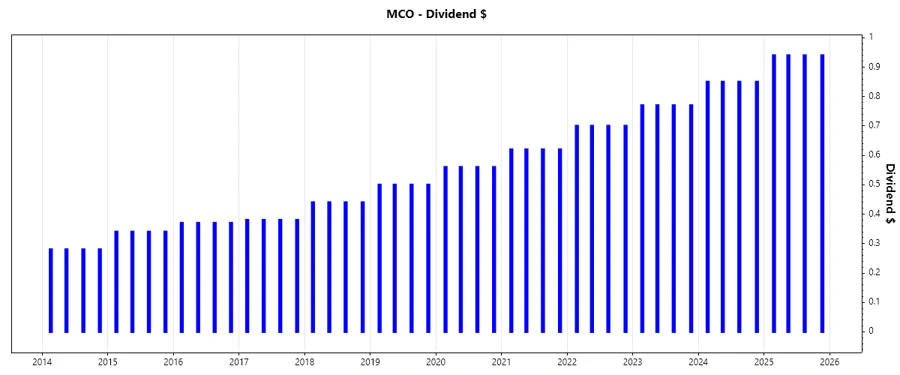
🗣️ Dividend History
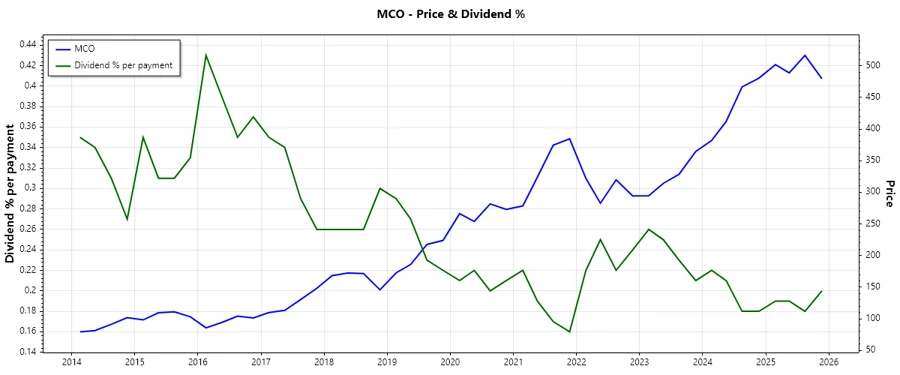
Moody's boasts a strong and consistent dividend history. This unwavering commitment to shareholder returns underlines its reliability as a dividend stock.
| Year | Dividend per Share (USD) |
|---|---|
| 2025 | 3.76 |
| 2024 | 3.40 |
| 2023 | 3.08 |
| 2022 | 2.80 |
| 2021 | 2.48 |
📈 Dividend Growth
The growth in Moody's dividends highlights its excellent financial health and operational efficiency. Over the last three and five years, Moody's has delivered consistent growth in dividends, which is crucial for long-term investment returns.
| Time | Growth |
|---|---|
| 3 years | 10.33% |
| 5 years | 10.91% |
The average dividend growth is 10.91% over 5 years. This shows moderate but steady dividend growth.
⚠️ Payout Ratio
Moody's maintains a prudent payout policy, reflected in its payout ratios. It ensures sufficient earnings retention for growth while rewarding shareholders consistently.
| Key Figure | Ratio |
|---|---|
| EPS-based | 27.28% |
| Free Cash Flow-based | 23.20% |
The 27.28% EPS payout ratio and 23.20% FCF payout ratio indicate a sustainable payout policy, keeping significant earnings for reinvestment.
💵 Cashflow & Capital Efficiency
An efficient use of capital and impressive cash flow management, illustrated by these metrics, are vital for sustaining operations and future dividend growth.
| Metric | 2024 | 2023 | 2022 |
|---|---|---|---|
| Free Cash Flow Yield | 2.93% | 2.63% | 2.32% |
| Earnings Yield | 2.39% | 2.25% | 2.68% |
| CAPEX to Operating Cash Flow | 11.17% | 12.60% | 19.20% |
| Stock Compensation to Revenue | 2.32% | 2.32% | 0% |
| Free Cash Flow / Operating Cash Flow Ratio | 88.83% | 87.40% | 80.81% |
The data suggests strong cash flow efficiency, supporting capital returns and strategic investments effectively. The FCF/OCF ratio illustrates robust cash conversion.
📉 Balance Sheet & Leverage Analysis
The evaluation of Moody's balance sheet metrics reveals a balanced leverage approach, ensuring resilience in fluctuating economic environments.
| Metric | 2024 | 2023 | 2022 |
|---|---|---|---|
| Debt-to-Equity | 2.17 | 2.23 | 3.12 |
| Debt-to-Assets | 0.50 | 0.51 | 0.55 |
| Debt-to-Capital | 0.68 | 0.69 | 0.76 |
| Net Debt to EBITDA | 1.50 | 2.10 | 2.64 |
| Current Ratio | 1.84 | 1.69 | 1.72 |
| Quick Ratio | 1.43 | 1.69 | 1.72 |
| Financial Leverage | 4.35 | 4.41 | 5.70 |
Moody's stability is reinforced by moderate leverage ratios and satisfactory liquidity levels, indicating strong financial health.
✅ Fundamental Strength & Profitability
With impressive profitability metrics, Moody's showcases robust fundamental strength, essential for sustaining market confidence and investor interest.
| Metric | 2024 | 2023 | 2022 |
|---|---|---|---|
| Return on Equity | 57.73% | 48.43% | 54.55% |
| Return on Assets | 13.27% | 10.99% | 9.58% |
| Margins - Net | 29.03% | 27.16% | 25.13% |
| Margins - EBIT | 40.96% | 36.21% | 36.14% |
| Margins - EBITDA | 47.04% | 42.51% | 42.19% |
| Margins - Gross | 66.41% | 65.15% | 64.45% |
Exceptional returns and margins underscore Moody's efficient operations and strategic prowess, promoting long-term investor value.
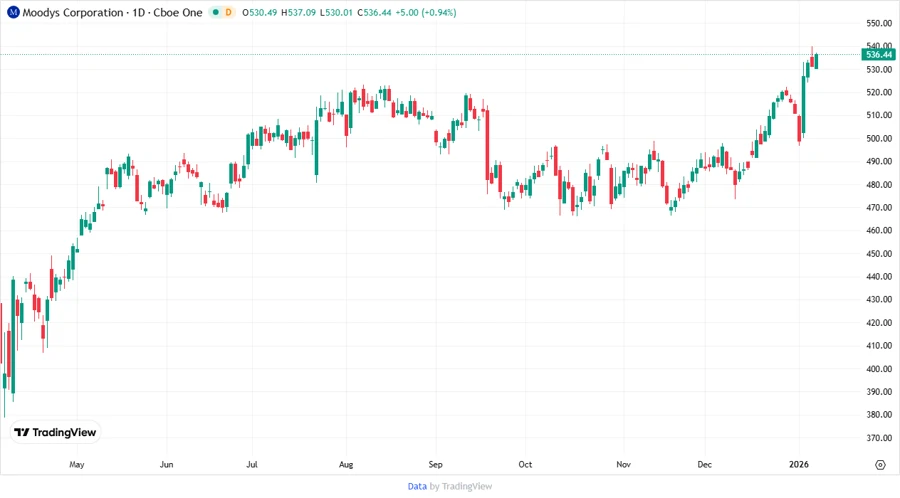
📈 Price Development
🌟 Dividend Scoring System
| Category | Score | Score Bar |
|---|---|---|
| Dividend Yield | 2 | |
| Dividend Stability | 5 | |
| Dividend Growth | 4 | |
| Payout Ratio | 5 | |
| Financial Stability | 4 | |
| Dividend Continuity | 5 | |
| Cashflow Coverage | 4 | |
| Balance Sheet Quality | 3 |
Total Score: 32/40
🗒️ Rating
Despite a modest dividend yield, Moody's Corporation's solid financial foundation and consistent dividend growth make it a strong contender for long-term income and capital appreciation investors. The overall assessment emphasizes a stable investment choice with ongoing growth potential.