November 04, 2025 a 02:46 am
MCO: Dividend Analysis - Moody's Corporation
Moody's Corporation, a leader in credit ratings, research, and risk analysis, demonstrates a robust and admirable dividend profile. With a dividend history spanning 26 years, the company maintained strong financial discipline. The current dividend yield is relatively low at 0.77%, reflecting a strategy focused on sustaining growth and continuous shareholder value.
📊 Overview
Moody's, operating in the Financial Sector, showcases its capacity to maintain consistent dividend payouts, supported by its resilient business model. Key metrics include:
| Key Metric | Details |
|---|---|
| Sector | Financial |
| Dividend Yield | 0.77% |
| Current Dividend per Share | 3.41 USD |
| Dividend History | 26 years |
| Last Cut or Suspension | None |
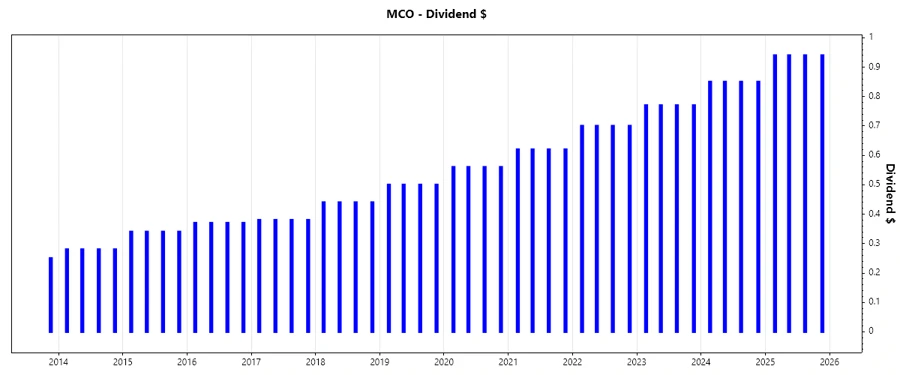
🗣️ Dividend History
The dividend history of Moody's is significant in sending a strong signal of the company's longevity and commitment to returning value to its shareholders. Sustained dividend payouts over decades indicate a reliable revenue stream and positive earnings trajectory.
| Year | Dividend per Share (USD) |
|---|---|
| 2025 | 3.76 |
| 2024 | 3.40 |
| 2023 | 3.08 |
| 2022 | 2.80 |
| 2021 | 2.48 |
📈 Dividend Growth
An examination of Moody's dividend growth reveals steady increments, pivotal for fostering investor confidence and projecting future financial health. This growth reflects Moody's strategic advancements and market presence.
| Time | Growth |
|---|---|
| 3 years | 11.09% |
| 5 years | 11.20% |
The average dividend growth is 11.20% over 5 years. This shows moderate but steady dividend growth.
📉 Payout Ratio
The payout ratio is a critical indicator of how sustainable a company’s dividend is concerning its earnings. Moody's displays disciplined payout ratios, suggesting a prudent balance between rewarding shareholders and retaining profits for growth.
| Key Figure | Ratio |
|---|---|
| EPS-based | 27.28% |
| Free cash flow-based | 23.20% |
The EPS-based payout ratio of 27.28% and FCF-based payout ratio of 23.20% outline that Moody's maintains a conservative approach, underpinning the reliability of its dividend payments.
✅ Cashflow & Capital Efficiency
Analyzing cash flow and capital efficiency offers insights into the company’s capacity to generate cash and utilize it effectively for operations and growth.
| Metrics | 2024 | 2023 | 2022 |
|---|---|---|---|
| Free Cash Flow Yield | 2.93% | 2.63% | 2.32% |
| Earnings Yield | 2.39% | 2.25% | 2.68% |
| CAPEX to Operating Cash Flow | 11.17% | 12.60% | 19.20% |
| Stock-based Compensation to Revenue | - | 0% | 0% |
| Free Cash Flow / Operating Cash Flow Ratio | 88.8% | 87.40% | 80.80% |
The efficient use of capital exemplified by the FCF/OFC ratios portrays Moody's as a company with strong cash flow stability and prudent capital deployment.
⚠️ Balance Sheet & Leverage Analysis
Investigation of the balance sheet and leverage metrics illustrates a company's financial robustness, liquidity, and potential risks associated with debt.
| Metrics | 2024 | 2023 | 2022 |
|---|---|---|---|
| Debt-to-Equity | 2.17 | 2.23 | 3.12 |
| Debt-to-Assets | 49.96% | 50.71% | 54.80% |
| Net Debt to EBITDA | 1.60 | 2.10 | 2.64 |
| Current Ratio | 1.84 | 1.69 | 1.72 |
| Quick Ratio | 1.43 | 1.69 | 1.72 |
While the leverage ratios are on the higher side, consistent current and quick ratios suggest Moody's maintains sufficient liquidity to manage its obligations effectively.
🔍 Fundamental Strength & Profitability
Fundamentals such as profitability ratios expose the inherent ability of the firm to deliver sustainable profits while ensuring optimal utilization of its resources.
| Metrics | 2024 | 2023 | 2022 |
|---|---|---|---|
| Return on Equity | 57.73% | 48.43% | 54.55% |
| Return on Assets | 13.27% | 10.99% | 9.58% |
| Net Profit Margin | 29.03% | 27.16% | 25.13% |
| Research & Development to Revenue | 0% | 0% | 0% |
High margins and returns demonstrate Moody's effective business management, whereas a lack of R&D investment indicates a focus in areas outside technological innovation, yet still consistently performing.
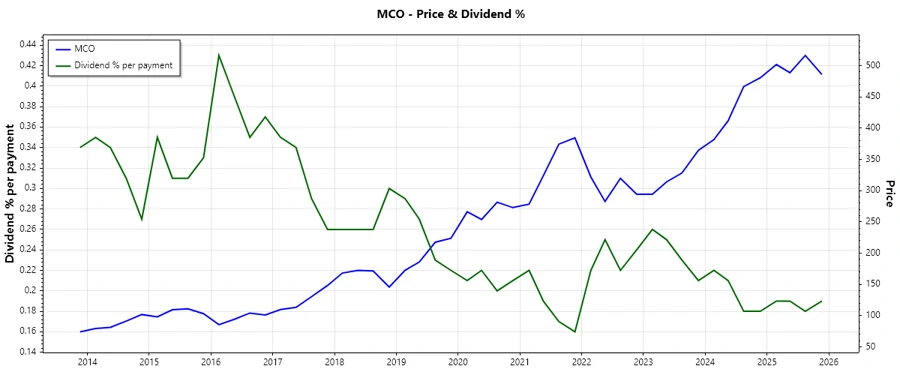
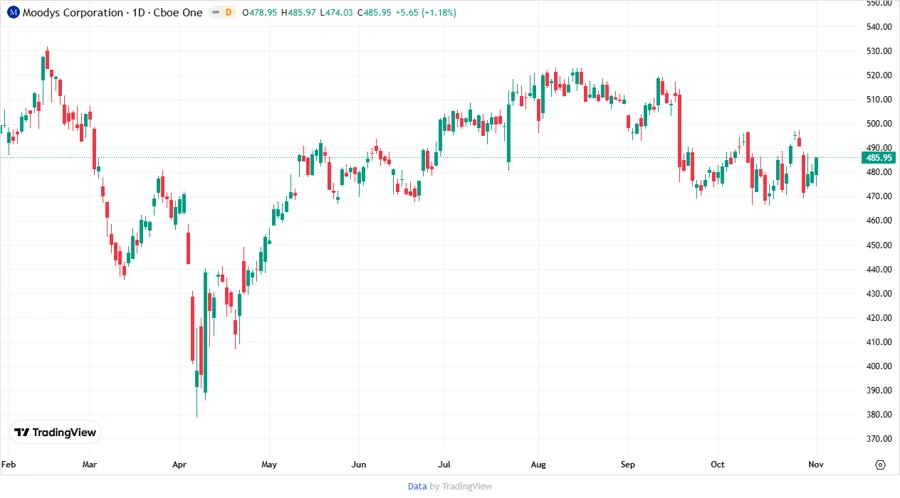
📈 Price Development
📊 Dividend Scoring System
| Criteria | Description | Score |
|---|---|---|
| Dividend Yield | Low yield reflecting potential growth focus | |
| Dividend Stability | 26 years without cuts | |
| Dividend Growth | Steady growth averaging 11.20% | |
| Payout Ratio | Conservative payout based on earnings | |
| Financial Stability | Strong cash flows and effective leverage management | |
| Dividend Continuity | Long history of payments | |
| Cashflow Coverage | Strong coverage of dividend with cash flow | |
| Balance Sheet Quality | Robust despite high leverage |
Overall Score: 29/40
🏆 Rating
Moody’s Corporation offers an attractive prospect for dividend investors who prioritize stability over high yield. Its conservative payout ratio and consistently growing dividends highlight a financially disciplined approach, suitable for long-term investors seeking reliable growth and a proven history of shareholder rewards.
Smart Data Insight
Master the Perfect Entry & Exit for this Stock
Don't leave your profits to chance. Historically, this stock follows specific seasonal patterns that institutional traders use to maximize returns.
- ✅ Identify the "Golden Buying Window"
- ✅ Avoid high-risk correction cycles
- ✅ Backtested data from the last 20+ years