August 17, 2025 a 11:31 am

MCO: Dividend Analysis - Moody's Corporation
Moody's Corporation presents a modest dividend yield with a long-standing history of consistent dividend payouts spanning over 26 years. Despite a relatively low yield, the steady dividend growth and solid payout ratios indicate a reliable income stream for shareholders. The firm’s commitment to shareholder returns, highlighted by continuous dividends and prudent capital management, makes it a notable consideration for income-focused investors.
📊 Overview
Moody's Corporation operates within the Financial Services sector, offering a dividend yield of 0.71%. It maintains a current dividend of 3.41 USD per share and boasts a robust 26-year history of uninterrupted dividends, without recent cuts or suspensions, underpinning its reliability in dividend distributions.
| Category | Details |
|---|---|
| Sector | Financial Services |
| Dividend yield | 0.71% |
| Current dividend per share | 3.41 USD |
| Dividend history | 26 years |
| Last cut or suspension | None |
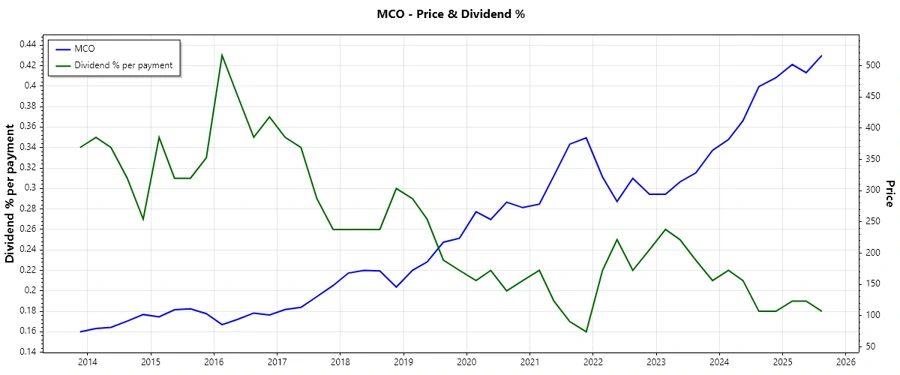
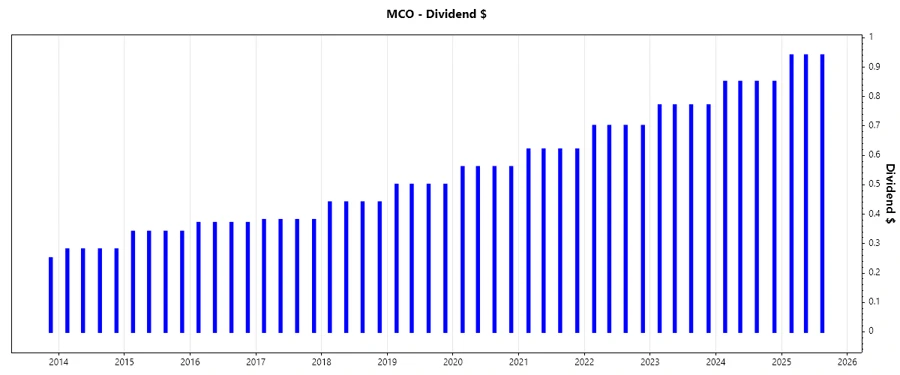
🗣️ Dividend History
The historical dividend data highlights Moody's strong track record in maintaining and increasing its dividend payouts. This consistency portrays a stable financial policy and disciplined earnings management, vital factors for long-term income investors.
| Year | Dividend per Share (USD) |
|---|---|
| 2025 | 2.82 |
| 2024 | 3.40 |
| 2023 | 3.08 |
| 2022 | 2.80 |
| 2021 | 2.48 |
📈 Dividend Growth
Moody's Corporation demonstrates a stable dividend growth trend with a growth rate of 11.19% over the last five years. Such consistent growth reflects the company's ability to enhance shareholder value through progressive income distribution.
| Time | Growth |
|---|---|
| 3 years | 11.09% |
| 5 years | 11.19% |
The average dividend growth is 11.19% over 5 years. This shows moderate but steady dividend growth.
✅ Payout Ratio
Payout ratios are indicative of how well earnings and free cash flow support dividend payouts, which are critical to assessing sustainability.
| Key Figure | Ratio |
|---|---|
| EPS-based | 28.78% |
| Free cash flow-based | 25.01% |
The EPS-based payout ratio of 28.78% and a free cash flow-based ratio of 25.01% suggest a conservative approach, offering a comfortable cushion for dividend sustainability.
📉 Cashflow & Capital Efficiency
Evaluating cash flow generation and capital efficiency factors is vital to understanding the company's financial strength and capacity to maintain or grow its dividends.
| Year | 2024 | 2023 | 2022 |
|---|---|---|---|
| Free Cash Flow Yield | 2.93% | 2.63% | 2.32% |
| Earnings Yield | 2.39% | 2.25% | 2.68% |
| CAPEX to Operating Cash Flow | 11.17% | 12.60% | 19.20% |
| Stock-based Compensation to Revenue | 3.10% | 3.26% | 3.09% |
| Free Cash Flow / Operating Cash Flow Ratio | 88.83% | 87.40% | 80.80% |
These metrics illustrate Moody's robust cash flows, ensuring further dividend sustainability amidst operational and capital challenges.
⚠️ Balance Sheet & Leverage Analysis
Comprehensive balance sheet analysis provides insights into financial stability, leverage levels, and liquidity positions critical for risk assessment.
| Year | 2024 | 2023 | 2022 |
|---|---|---|---|
| Debt-to-Equity | 2.17 | 2.23 | 3.12 |
| Debt-to-Assets | 0.50 | 0.51 | 0.55 |
| Debt-to-Capital | 0.68 | 0.69 | 0.76 |
| Net Debt to EBITDA | 1.54 | 2.03 | 2.61 |
| Current Ratio | 1.47 | 1.74 | 1.72 |
| Quick Ratio | 1.47 | 1.74 | 3.20 |
| Financial Leverage | 4.35 | 4.41 | 5.70 |
Stability in financial leverage and solid liquidity metrics indicate that Moody’s manages its debt effectively while maintaining financial flexibility, beneficial when considering dividends.
🔍 Fundamental Strength & Profitability
The company’s profitability ratios showcase its capability to generate earnings relative to its investments, critically supporting its dividend payout strategy.
| Year | 2024 | 2023 | 2022 |
|---|---|---|---|
| Return on Equity | 57.73% | 48.43% | 54.55% |
| Return on Assets | 13.27% | 10.99% | 9.58% |
| Net Margin | 29.03% | 27.16% | 25.13% |
| EBIT Margin | 42.86% | 37.74% | 36.69% |
| EBITDA Margin | 48.94% | 44.05% | 42.70% |
| Gross Margin | 72.56% | 71.48% | 70.50% |
Moody's profitability and efficiency ratios reveal strong returns on equity and assets, verifying sound investment returns and solidifying its dividend-paying capability.
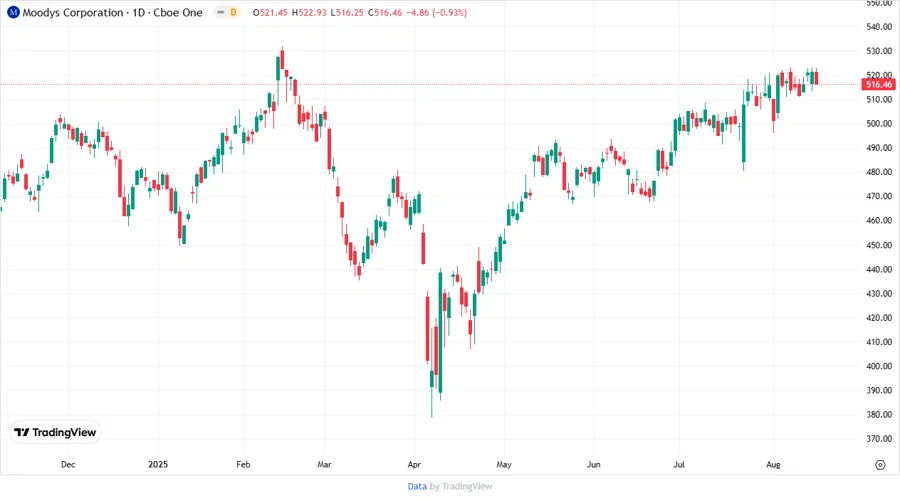
📋 Price Development
🌟 Dividend Scoring System
| Criteria | Score | Bar |
|---|---|---|
| Dividend yield | 2 | |
| Dividend Stability | 5 | |
| Dividend growth | 4 | |
| Payout ratio | 4 | |
| Financial stability | 4 | |
| Dividend continuity | 5 | |
| Cashflow Coverage | 3 | |
| Balance Sheet Quality | 4 |
Total Score: 31/40
🗳️ Rating
Moody's Corporation is a solid income-generating investment due to its unwavering dividend history and prudent payout strategies. While its yield is modest, the firm compensates through consistent growth and robust financial management, making it a compelling choice for steady income-seeking investors.
Smart Data Insight
Master the Perfect Entry & Exit for this Stock
Don't leave your profits to chance. Historically, this stock follows specific seasonal patterns that institutional traders use to maximize returns.
- ✅ Identify the "Golden Buying Window"
- ✅ Avoid high-risk correction cycles
- ✅ Backtested data from the last 20+ years