
July 04, 2026 a 03:15 am
MCHP: Trend and Support & Resistance Analysis - Microchip Technology Incorporated
Microchip Technology Incorporated has demonstrated a fluctuation in its stock prices over the past few months, reflecting both opportunities and challenges within the embedded control solutions market. Investors are advised to assess these trends, particularly in the context of the macroeconomic environment and technological advancements. The recent stock performance highlights potential entry points, albeit with caution due to market volatility. Overall, careful analysis of the EMA indicators and support-resistance zones will aid in better decision-making regarding stock movement.
Trend Analysis
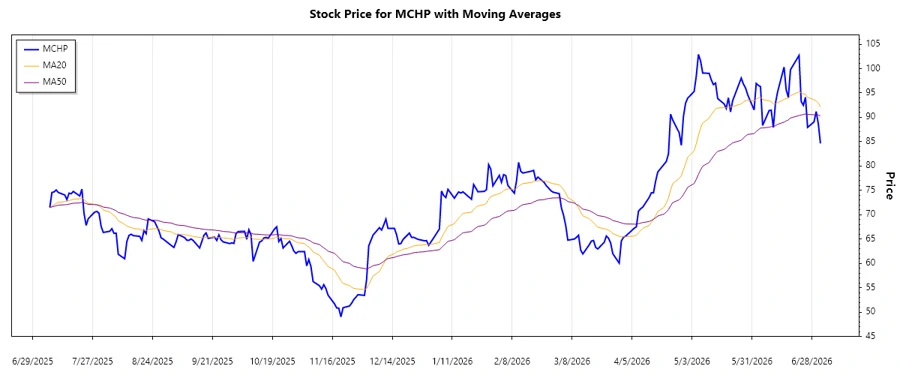
The analysis of daily stock data for Microchip Technology Incorporated reveals a slight downward trend over the last several weeks. Calculating the 20-day EMA and 50-day EMA helps to ascertain the trend direction accurately.
| Date | Close Price | Trend |
|---|---|---|
| 2026-07-02 | 84.64 | 🔴 ▼ |
| 2026-07-01 | 88.69 | 🔴 ▼ |
| 2026-06-30 | 91.20 | 🟢 ⚖️ |
| 2026-06-29 | 89.06 | 🔴 ▼ |
| 2026-06-26 | 87.93 | 🔴 ▼ |
| 2026-06-25 | 94.12 | 🟢 ▲ |
| 2026-06-24 | 92.48 | 🔴 ⚖️ |
The 20-day EMA is currently below the 50-day EMA, indicating a bearish trend. However, if the EMA crosses in the future, the direction could change, signaling potential bullish activities.
Support- and Resistance
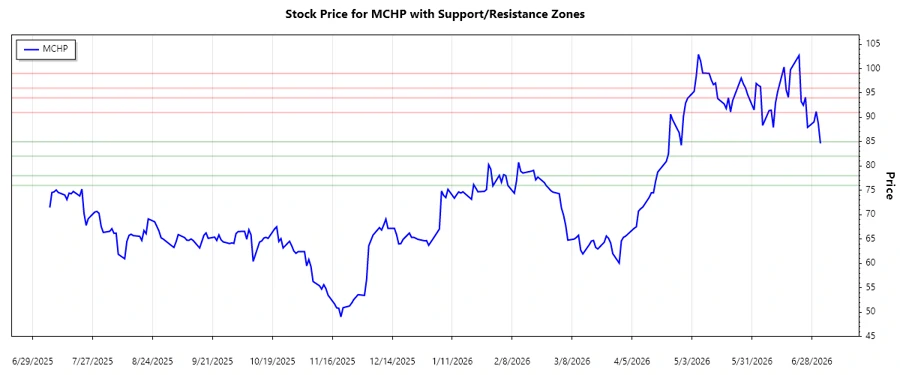
By analyzing the closing prices, two primary support and resistance zones have been identified. These zones are essential in understanding potential reversal levels and trader sentiment.
| Support Zone | Resistance Zone |
|---|---|
| 82.00 - 85.00 🔴 | 91.00 - 94.00 🟢 |
| 76.00 - 78.00 🔴 | 96.00 - 99.00 🟢 |
The current stock price is close to the upper support zone, suggesting that while it is near the support, attention should be given to any breakthrough or bounce back observed within this zone.
Conclusion
In conclusion, Microchip Technology Incorporated shows signs of potential market volatility. Trends and key support and resistance levels suggest vigilance among investors. Given the current bearish trend signaled by the EMAs, opportunities lie in monitoring support levels for potential entry points. However, the presence of resistance zones above suggests caution as upward movements might face challenges. Market participants should strategize based on these indicators and incorporate external economic and industry dynamics into their analysis for a comprehensive approach.
Smart Data Insight
Master the Perfect Entry & Exit for this Stock
Don't leave your profits to chance. Historically, this stock follows specific seasonal patterns that institutional traders use to maximize returns.
- ✅ Identify the "Golden Buying Window"
- ✅ Avoid high-risk correction cycles
- ✅ Backtested data from the last 20+ years