
June 02, 2026 a 03:43 pm

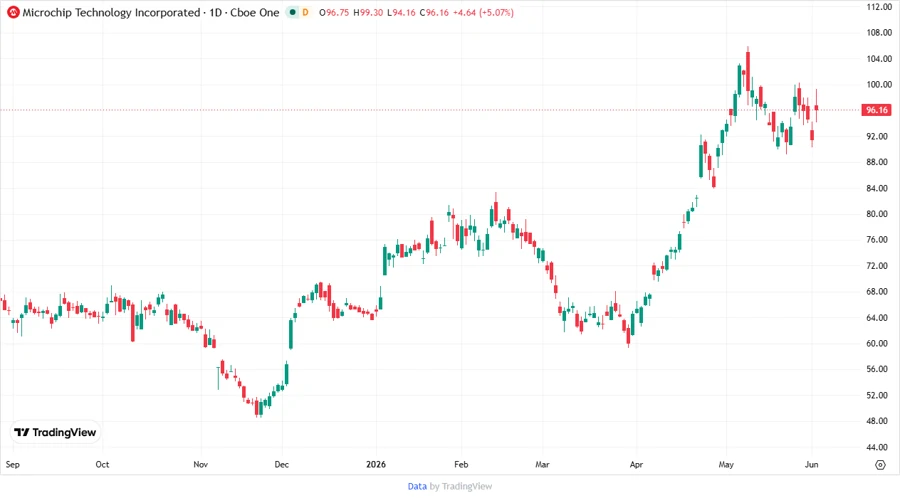
MCHP: Fundamental Ratio Analysis - Microchip Technology Incorporated
Microchip Technology Incorporated, a key player in the semiconductor industry, presents a mixed financial outlook. While the company's diverse product line positions it well in the market, recent financial metrics suggest cautious optimism.
Fundamental Rating
Microchip Technology Incorporated has been assigned a 'C+' rating based on its current financial metrics. Below is a breakdown of the fundamental scores in various categories.
| Category | Score | Visualization |
|---|---|---|
| Discounted Cash Flow | 3 | |
| Return on Equity | 3 | |
| Return on Assets | 3 | |
| Debt to Equity | 1 | |
| Price to Earnings | 1 | |
| Price to Book | 2 |
Historical Rating
Comparative score analysis highlights how Microchip’s key financial metrics have evolved over recent periods.
| Date | Overall | DCF | ROE | ROA | Debt to Equity | P/E | P/B |
|---|---|---|---|---|---|---|---|
| 2026-06-01 | 2 | 3 | 3 | 3 | 1 | 1 | 2 |
| 2026-06-02 | 2 | 3 | 3 | 3 | 1 | 1 | 2 |
Analyst Price Targets
Current analyst price targets suggest several scenarios, providing investors with a comprehensive view of potential future valuations.
| High | Low | Median | Consensus |
|---|---|---|---|
| 135 | 85 | 105 | 107.82 |
Analyst Sentiment
Analyst sentiment exhibits a positive bias with a significant number of buy recommendations.
| Recommendation | Count | Visualization |
|---|---|---|
| Strong Buy | 2 | |
| Buy | 30 | |
| Hold | 14 | |
| Sell | 0 | |
| Strong Sell | 0 |
Conclusion
Microchip Technology Incorporated holds a pivotal role in the semiconductor industry, yet its performance remains moderate, indicated by a 'C+' rating. While the company benefits from a broad spectrum of products and strong buy recommendations, challenges remain in debt management and value ratios. Historical analyses show consistency in its scores, suggesting stability. Investor optimism persists, driven by positive analyst price targets and a predominant 'Buy' consensus, hinting at potential growth opportunities amidst existing risks.
Smart Data Insight
Master the Perfect Entry & Exit for this Stock
Don't leave your profits to chance. Historically, this stock follows specific seasonal patterns that institutional traders use to maximize returns.
- ✅ Identify the "Golden Buying Window"
- ✅ Avoid high-risk correction cycles
- ✅ Backtested data from the last 20+ years