April 08, 2026 a 03:15 pm
MCHP: Fibonacci Analysis - Microchip Technology Incorporated
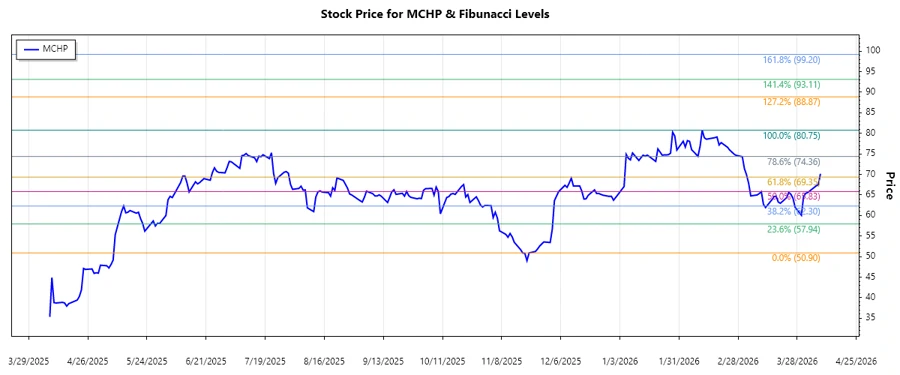
The stock of Microchip Technology Incorporated has shown a notable upward trend in recent months due to a rise in demand for its embedded control solutions. This trend is significant as it reflects the company's capacity to meet evolving technological needs across multiple industries. With its robust portfolio and strategic presence worldwide, the stock’s performance mirrors its ongoing growth in the smart, connected, and secure applications markets. However, investors should remain cautious of market volatilities that could affect its stock price.
Fibonacci Analysis
| Details | Values |
|---|---|
| Start Date | 2025-11-21 |
| End Date | 2026-04-08 |
| High Point (Price and Date) | $80.75 (2026-02-11) |
| Low Point (Price and Date) | $50.9 (2025-11-21) |
| Fibonacci Level | Price Levels |
|---|---|
| 0.236 | $58.59 |
| 0.382 | $61.52 |
| 0.5 | $64.35 |
| 0.618 | $67.18 |
| 0.786 | $71.20 |
The current price of $70.155 is in the 0.786 retracement zone, indicating potential resistance. Investors should watch if this level holds, which could signal a reversal or correction.
This level could act as resistance, suggesting that MCHP may face challenges breaking above $71.20 unless demand significantly strengthens.
Conclusion
The analysis highlights an uptrend in MCHP's stock, characterized by recent technical resistance at the 0.786 Fibonacci retracement level. While the stock demonstrates growth potential and signifies market confidence, it’s crucial to consider broader economic indicators that could impact its trajectory. Analysts should monitor the stock for potential breakouts above resistance levels, which might pave the way for continued gains. However, the presence of external volatilities suggests a balanced strategy approach. Investors can potentially benefit from MCHP's innovations and sector presence, provided they stay vigilant regarding macroeconomic shifts and industry-specific disruptions.