September 21, 2025 a 03:15 pm
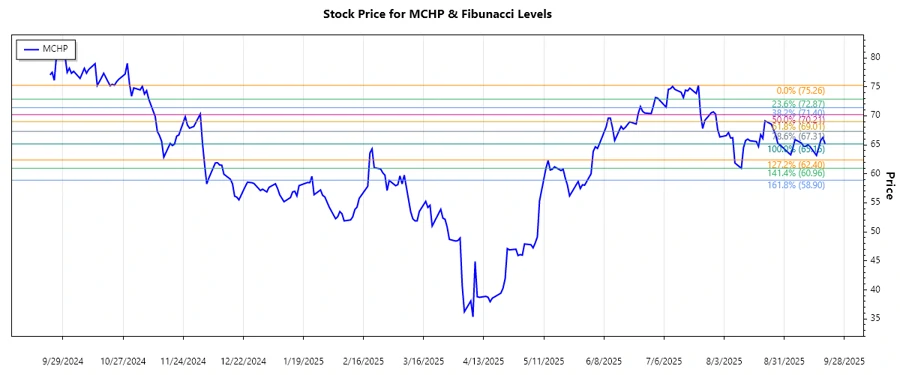
MCHP: Fibonacci Analysis - Microchip Technology Incorporated
The MCHP stock has shown significant volatility in the recent months. After reaching a peak in late July 2025, the price has experienced a downward trend, settling in the mid-60s by mid-September. This analysis focuses on whether the current retracement levels could signal potential buying opportunities or further price declines.
Fibonacci Analysis
The MCHP stock recently experienced a dominant downtrend. Based on historical data, the most notable high point was on July 22, 2025, at $75.26, while the lowest point occurred on September 19, 2025, at $65.15. Using these points, we can calculate the Fibonacci Retracement Levels to identify potential support and resistance levels.
| Parameters | Details |
|---|---|
| Trend Start Date | 2025-07-22 |
| Trend End Date | 2025-09-19 |
| High Point | $75.26 on 2025-07-22 |
| Low Point | $65.15 on 2025-09-19 |
| Fibonacci Level | Price Level |
|---|---|
| 0.236 | $67.75 |
| 0.382 | $69.32 |
| 0.5 | $70.21 |
| 0.618 | $71.10 |
| 0.786 | $72.61 |
Current Price: $65.15. The current price is below the 0.236 retracement level, indicating the possibility of the stock trading in a bearish trend. If the price moves into the retracement zone starting from 0.236, it may signal a potential reversal or a support zone.
Technically, it suggests possible support around $65.15 and resistance near $67.75. Careful monitoring of these levels could provide insights into further price movements.
Conclusion
Analyzing the MCHP stock reveals both opportunities and risks. The downtrend since mid-2025 indicates decreasing investor confidence. However, if support levels around $65.15 hold, it might herald a potential reversal. Analysts should keep a close eye on the price movements within the Fibonacci retracement levels. Opportunities lie in a potential upwards retracement, while risks remain in breaking below the recent lows. These technical signals should be viewed alongside broader market conditions and company fundamentals for a holistic investment strategy.
Smart Data Insight
Master the Perfect Entry & Exit for this Stock
Don't leave your profits to chance. Historically, this stock follows specific seasonal patterns that institutional traders use to maximize returns.
- ✅ Identify the "Golden Buying Window"
- ✅ Avoid high-risk correction cycles
- ✅ Backtested data from the last 20+ years