September 03, 2025 a 04:44 pm
MCHP: Fibonacci Analysis - Microchip Technology Incorporated
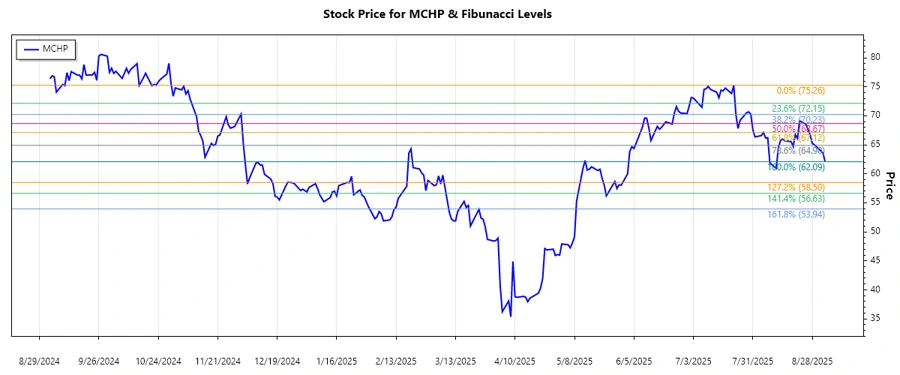
Microchip Technology's stock (MCHP) has shown significant volatility over recent months, reflecting broader tech market trends. Recently, its trajectory demonstrated a clear downward trend, signaling potential stabilization at lower support levels. The current retracement levels could offer key insights into potential price reversal areas for investors interested in technicals.
Fibonacci Analysis
| Trend Duration | High Point (Date) | High Point (Price) | Low Point (Date) | Low Point (Price) | Retracement Levels |
|---|---|---|---|---|---|
| 2025-02-20 to 2025-09-03 | 2025-07-22 | 75.26 | 2025-09-03 | 62.085 |
0.236: 71.91 0.382: 70.30 0.5: 68.67 0.618: 67.04 0.786: 64.92 |
Current analysis suggests that the price is nearing the 50% retracement level, a historically significant level in technical analysis that often indicates strong support or resistance. Should the price rebound from this level, it might signal bullish momentum, whereas a break below it could suggest further bearish tendencies.
Conclusion
The recent downward trend in Microchip Technology's stock highlights potential risks, especially if bearish momentum continues past key Fibonacci levels. However, this also presents opportunities, especially for investors eyeing technical bounce possibilities at identified retracement points. Attention to support levels like the 50% Fibonacci line could be crucial in determining future price movements. While the technical outlook remains cautious, potential stabilization or reversal can make MCHP a compelling watch for traders.
Smart Data Insight
Master the Perfect Entry & Exit for this Stock
Don't leave your profits to chance. Historically, this stock follows specific seasonal patterns that institutional traders use to maximize returns.
- ✅ Identify the "Golden Buying Window"
- ✅ Avoid high-risk correction cycles
- ✅ Backtested data from the last 20+ years