
June 11, 2026 a 03:31 pm

MCHP: Dividend Analysis - Microchip Technology Incorporated
Microchip Technology Incorporated, with a strong dividend history of 25 years, demonstrates stability in delivering consistent payouts to its shareholders. Its dividend yield stands at 1.95%, suggesting a steady income stream. However, the high payout ratio raises questions about its sustainability, especially given the substantial reliance on free cash flow. Investors should balance these aspects while assessing its viability as a long-term dividend play.
📊 Overview
The financial sector is characterized by stable but relatively low growth rates. Microchip Technology Incorporated offers a dividend yield of 1.95%, aligning with industry standards. The company has been paying dividends consecutively for 25 years, with the most recent dividend per share at $2.02. There has been no recent cut or suspension, indicating consistent dividend policies.
| Metric | Value |
|---|---|
| Sector | Technology |
| Dividend yield | 1.95% |
| Current dividend per share | $2.02 |
| Dividend history | 25 years |
| Last cut or suspension | None |
🕰️ Dividend History
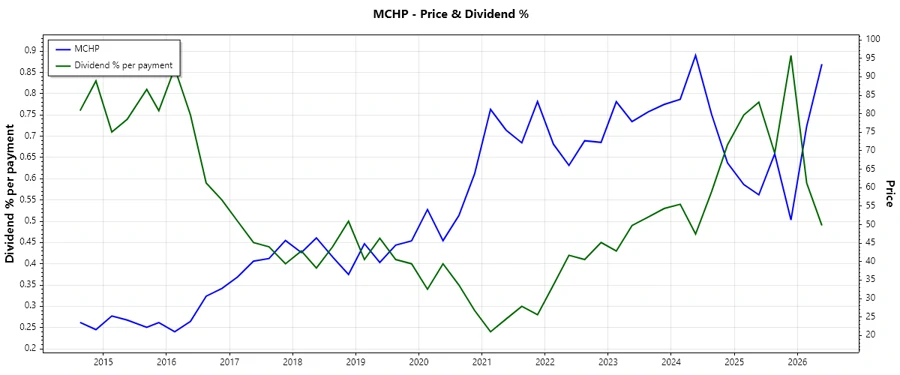
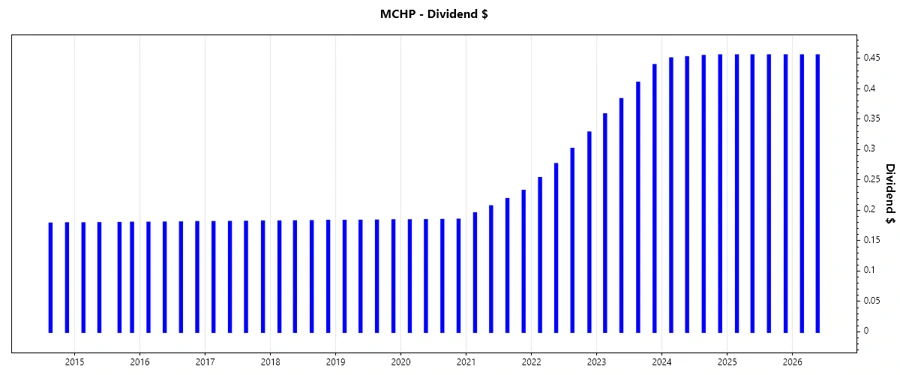
The robust dividend history of Microchip Technology emphasizes its commitment to returning capital to shareholders. This long-term track record is attractive to investors seeking reliable income. Consistent dividend payments underscore the company’s operational stability, which is crucial for sustaining investor confidence.
| Year | Dividend per Share (USD) |
|---|---|
| 2026 | $0.910 |
| 2025 | $1.820 |
| 2024 | $1.811 |
| 2023 | $1.590 |
| 2022 | $1.158 |
📈 Dividend Growth
Examining the dividend growth rates over three and five years provides insights into the company’s capacity for future enhancements in shareholder payouts. Maintaining moderate growth is crucial for keeping pace with inflation and providing real income growth.
| Time | Growth |
|---|---|
| 3 years | 16.27% |
| 5 years | 19.86% |
The average dividend growth is 19.86% over 5 years. This shows moderate but steady dividend growth, crucial for long-term investors aiming to preserve purchasing power.
🗣️ Payout Ratio
The payout ratio is an essential metric for evaluating dividend sustainability. It's vital to compare the earnings-based payout ratio with the free cash flow-based payout ratio to gauge the company's financial flexibility in maintaining dividend payments.
| Key figure | Ratio |
|---|---|
| EPS-based | 540.31% |
| Free cash flow-based | 125.56% |
With an EPS payout ratio of 540.31% and a free cash flow payout ratio of 125.56%, there is a significant concern about the sustainability of the dividend from earnings. However, free cash flow provides more room for dividend security.
💸 Cashflow & Capital Efficiency
| Year | 2026 | 2025 | 2024 |
|---|---|---|---|
| Free Cash Flow Yield | 2.49% | 2.97% | 5.36% |
| Earnings Yield | 0.58% | -0.19% | 3.92% |
| CAPEX to Operating Cash Flow | 0.095 | 0.140 | 0.099 |
| Stock-based Comp. to Revenue | 5.42% | 4.10% | 2.33% |
| Free Cash Flow / Operating Cash Flow Ratio | 90.53% | 85.97% | 90.14% |
Microchip's cash flow stability, measured by factors like free cash flow yield, reflects solid capital efficiency. The Free Cash Flow to Operating Cash Flow ratio signifies good liquidity and capacity to cover dividends with cash flows generated from operations.
📊 Balance Sheet & Leverage Analysis
| Year | 2026 | 2025 | 2024 |
|---|---|---|---|
| Debt-to-Equity | 86.05% | 80.05% | 90.61% |
| Debt-to-Assets | 38.52% | 36.85% | 38.00% |
| Debt-to-Capital | 46.25% | 44.46% | 47.54% |
| Net Debt to EBITDA | 7.44 | 4.70 | 1.66 |
| Current Ratio | 2.09 | 2.59 | 1.20 |
| Quick Ratio | 1.18 | 1.47 | 0.67 |
| Financial Leverage | 2.23 | 2.17 | 2.38 |
The balance sheet reflects key leverage ratios that signal financial stability. A positive current ratio and manageable debt levels indicate a solid liquidity position, suggesting resilience under economic fluctuations.
📉 Fundamental Strength & Profitability
| Year | 2026 | 2025 | 2024 |
|---|---|---|---|
| Return on Equity | 3.14% | -0.007% | 28.64% |
| Return on Assets | 1.41% | -0.003% | 12.01% |
| Margins: Net | 4.29% | -0.011% | 24.98% |
| Margins: EBIT | 15.09% | 6.60% | 33.49% |
| Margins: EBITDA | 15.09% | 23.64% | 45.01% |
| Margins: Gross | 57.73% | 56.07% | 65.44% |
| R&D to Revenue | 23.04% | 22.35% | 14.37% |
Microchip's profitability, underlined by a strong return on equity and healthy margins, underscores its ability to generate value. Effective R&D spending enhances long-term innovation leadership and growth potential.
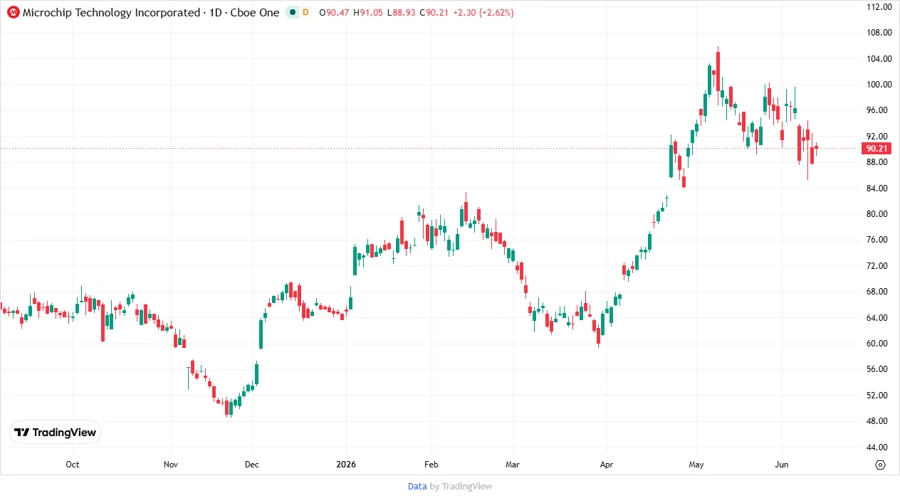
📅 Price Development
🔍 Dividend Scoring System
| Metric | Score | Score Bar |
|---|---|---|
| Dividend yield | 3 | |
| Dividend Stability | 5 | |
| Dividend growth | 4 | |
| Payout ratio | 2 | |
| Financial stability | 3 | |
| Dividend continuity | 5 | |
| Cashflow Coverage | 3 | |
| Balance Sheet Quality | 4 |
Overall Score: 29/40
✅ Rating
Microchip Technology Incorporated presents a mixed picture with robust historical dividend stability but concerning payout ratios due to earnings. While the company offers moderate dividend growth and consistent payouts, the high EPS payout ratio could put pressure on future dividend security. Investors might consider this stock for long-term holding, provided they keep a watchful eye on earnings and cash flow trends.
Smart Data Insight
Master the Perfect Entry & Exit for this Stock
Don't leave your profits to chance. Historically, this stock follows specific seasonal patterns that institutional traders use to maximize returns.
- ✅ Identify the "Golden Buying Window"
- ✅ Avoid high-risk correction cycles
- ✅ Backtested data from the last 20+ years