October 14, 2025 a 02:46 am


MCHP: Dividend Analysis - Microchip Technology Incorporated
Microchip Technology Incorporated presents an intriguing profile with its consistent dividend payments and a substantial history of 24 years without a cut. However, the volatility in payout ratios indicates potential risks worth monitoring for sustained income reliability.
📊 Overview
Microchip Technology, operating within the semiconductor sector, showcases a dividend yield of 2.63%, reflecting moderate income generation for investors. The company consistently pays a current dividend per share of $1.82, backed by a solid dividend history spanning over 24 years.
| Sector | Dividend Yield | Current Dividend per Share | Dividend History | Last Cut/Suspension |
|---|---|---|---|---|
| Semiconductor | 2.63% | 1.82 USD | 24 years | None |
📈 Dividend History
Microchip Technology has demonstrated a robust history of dividend payments, reflective of its commitment to returning value to shareholders. This enduring track record instills confidence in its financial stability.
| Year | Dividend per Share (USD) |
|---|---|
| 2025 | 1.365 |
| 2024 | 1.811 |
| 2023 | 1.590 |
| 2022 | 1.158 |
| 2021 | 0.852 |
📉 Dividend Growth
The dividend growth rate is a critical factor in assessing the long-term sustainability of payouts. With a growth of 28.58% over the last 3 years and 19.87% over the past 5 years, Microchip Technology shows a commendable trajectory indicating stability in shareholder returns.
| Time | Growth |
|---|---|
| 3 years | 28.58% |
| 5 years | 19.87% |
The average dividend growth is 19.87% over 5 years. This shows moderate but steady dividend growth.
✅ Payout Ratio
The payout ratio provides insights into the sustainability of dividend payments. A negative EPS-based payout ratio of -659.80% alongside an FCF-based payout ratio of 135.06% suggests that Microchip Technology may not be appropriately covering its dividends from profits, instead relying on free cash flow.
| Key Figure | Ratio |
|---|---|
| EPS-based | -659.80% |
| Free cash flow-based | 135.06% |
💸 Cashflow & Capital Efficiency
Analyzing the company's cash flow and capital efficiency metrics reveals how effectively it reinvests earnings to generate cash flow. Consistent cash generation and efficient use of capital are paramount for covering dividends and supporting growth initiatives.
| Metric | 2023 | 2024 | 2025 |
|---|---|---|---|
| Free Cash Flow Yield | 6.80% | 5.36% | 2.97% |
| Earnings Yield | 4.85% | 3.92% | -0.19% |
| CAPEX to Operating Cash Flow | 13.43% | 9.86% | 14.03% |
| Stock-based Compensation to Revenue | 2.02% | 2.33% | 4.09% |
| Free Cash Flow / Operating Cash Flow Ratio | 86.57% | 90.14% | 85.97% |
⚖️ Balance Sheet & Leverage Analysis
Examining balance sheet metrics such as the debt-to-equity ratio and liquidity ratios sheds light on financial stability and potential risks associated with leverage. effective management of leverage is crucial in maintaining creditworthiness and ensuring sustainable dividends.
| Metric | 2023 | 2024 | 2025 |
|---|---|---|---|
| Debt-to-Equity | 1.01 | 0.91 | 0.80 |
| Debt-to-Assets | 40.32% | 38.00% | 36.85% |
| Debt-to-Capital | 50.33% | 47.54% | 44.46% |
| Net Debt to EBITDA | 1.55 | 1.66 | 4.70 |
| Current Ratio | — | — | — |
| Quick Ratio | 0.56 | 0.67 | 1.47 |
| Financial Leverage | 2.51 | 2.38 | 2.17 |
🔍 Fundamental Strength & Profitability
Assessing profitability measures such as ROE and gross margins provides insight into the company's ability to generate profits relative to its equity and revenue. Strong profitability enhances dividend sustainability and potential growth.
| Metric | 2023 | 2024 | 2025 |
|---|---|---|---|
| Return on Equity | 34.35% | 28.64% | −0.007% |
| Return on Assets | 13.67% | 12.01% | −0.003% |
| Margins: Net | 26.52% | 24.98% | −0.011% |
| Research & Development to Revenue | 13.25% | 14.37% | 22.35% |
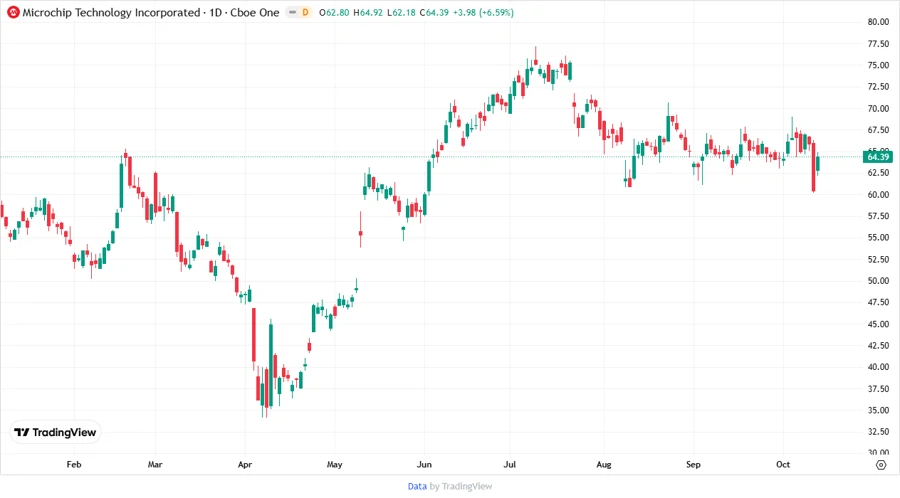
📈 Price Development
🗣️ Dividend Scoring System
Assessment across multiple criteria provides a comprehensive understanding of dividend sustainability and growth potential.
| Category | Score | Visual |
|---|---|---|
| Dividend Yield | 3 | |
| Dividend Stability | 4 | |
| Dividend Growth | 4 | |
| Payout Ratio | 2 | |
| Financial Stability | 3 | |
| Dividend Continuity | 5 | |
| Cashflow Coverage | 3 | |
| Balance Sheet Quality | 3 |
Overall Score: 27 out of 40
🗣️ Rating
Microchip Technology presents a solid dividend profile characterized by strong historical growth and stability. While the payout ratios suggest some caution, long-term investors may find its consistent dividend history appealing within the semiconductor sector. Continued monitoring of leverage and profitability measures is advised to ensure sustained returns.
Smart Data Insight
Master the Perfect Entry & Exit for this Stock
Don't leave your profits to chance. Historically, this stock follows specific seasonal patterns that institutional traders use to maximize returns.
- ✅ Identify the "Golden Buying Window"
- ✅ Avoid high-risk correction cycles
- ✅ Backtested data from the last 20+ years