September 04, 2025 a 03:31 am


MCHP: Dividend Analysis - Microchip Technology Incorporated
Microchip Technology Incorporated presents a complex dividend profile with a reasonable yield of 2.63%. The company's resilience is demonstrated by a 24-year uninterrupted dividend history, highlighting its commitment to returning value to shareholders. However, analysis of payout ratios and earnings raises concerns about sustainability. Investors should assess the growth trajectory and potential risks linked with high leverage.
📊 Overview
Microchip Technology operates within the semiconductors sector, exhibiting a moderate dividend yield of 2.63%. The current dividend per share stands at 1.82 USD, backed by a solid 24-year history without cuts, signifying reliability.
| Category | Details |
|---|---|
| Sector | Semiconductors |
| Dividend yield | 2.63 % |
| Current dividend per share | 1.82 USD |
| Dividend history | 24 years |
| Last cut or suspension | None |
🗣️ Dividend History
Microchip's dividend history underscores its financial discipline and commitment to shareholders. Understanding past dividends provides insights into future potential payouts and overall financial health.
| Year | Dividend per Share (USD) |
|---|---|
| 2025 | 1.365 |
| 2024 | 1.811 |
| 2023 | 1.590 |
| 2022 | 1.158 |
| 2021 | 0.852 |
📈 Dividend Growth
The history of dividend growth indicates the company's capacity to increase shareholder returns. Over the last 3 years, growth was minimal at 0.29%, highlighting some caution about future increases.
| Time | Growth |
|---|---|
| 3 years | 0.29 % |
| 5 years | 0.20 % |
The average dividend growth is 0.20% over 5 years. This shows moderate but steady dividend growth, suggesting a conservative but consistent dividend policy.
⚠️ Payout Ratio
Payout ratios are crucial for understanding dividend sustainability. A negative EPS payout ratio of -659.80% is concerning, indicating dividends exceed net income and are unsustainable without additional income sources.
| Key figure | Ratio |
|---|---|
| EPS-based | -659.80 % |
| Free cash flow-based | 135.06 % |
The EPS and FCF payout ratios suggest potential risk with the current dividend policy, requiring close monitoring.
💡 Cashflow & Capital Efficiency
This section evaluates a company's efficiency in generating cash flow and utilizing capital. Essential for sustaining operations and dividends.
| Measure | 2025 | 2024 | 2023 |
|---|---|---|---|
| Free Cash Flow Yield | 2.97% | 5.36% | 6.80% |
| Earnings Yield | -0.20% | 3.92% | 4.85% |
| CAPEX to Operating Cash Flow | 14.03% | 9.86% | 13.43% |
| Stock-based Compensation to Revenue | 4.10% | 2.33% | 2.02% |
| Free Cash Flow / Operating Cash Flow Ratio | 85.97% | 90.14% | 86.57% |
Microchip's cash flow metrics suggest robust generation, but earnings yield is a concern. Capital efficiency is adequate for funding future growth and dividends.
🧾 Balance Sheet & Leverage Analysis
Evaluating leverage and liquidity is vital for risk assessment and understanding a company’s capacity to manage debts.
| Measure | 2025 | 2024 | 2023 |
|---|---|---|---|
| Debt-to-Equity | 0.80 | 0.91 | 1.01 |
| Debt-to-Assets | 0.37 | 0.38 | 0.40 |
| Debt-to-Capital | 0.44 | 0.48 | 0.50 |
| Net Debt to EBITDA | 4.70 | 1.66 | 1.55 |
| Current Ratio | 2.59 | 1.20 | 0.98 |
| Quick Ratio | 1.47 | 0.67 | 0.56 |
| Financial Leverage | 2.17 | 2.38 | 2.51 |
Microchip's leverage rose significantly, affecting financial stability. Enhancing liquidity and reducing debt-to-equity is essential.
📉 Fundamental Strength & Profitability
Assessing Microchip's profitability and fundamental strength shows its capability to sustain returns and growth under different market conditions.
| Measure | 2025 | 2024 | 2023 |
|---|---|---|---|
| Return on Equity | -0.007% | 28.64% | 34.35% |
| Return on Assets | -0.003% | 12.01% | 13.67% |
| Net Margin | -0.011% | 24.98% | 26.52% |
| EBIT Margin | 6.60% | 33.49% | 36.78% |
| EBITDA Margin | 23.64% | 45.04% | 48.73% |
| Gross Margin | 56.07% | 65.44% | 67.52% |
| R&D to Revenue | 22.35% | 14.37% | 13.25% |
The company shows strong profitability and fundamental resilience. However, maintaining ROE and reducing R&D to revenue would be beneficial.
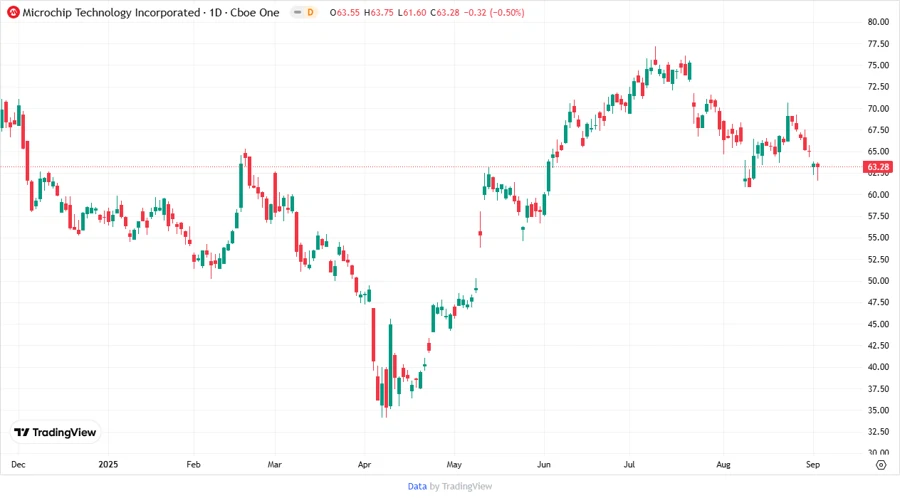
📊 Price Development
✅ Dividend Scoring System
Microchip's dividend scoring highlights areas of strength and potential risk, assisting investors in decision-making.
| Criterion | Score (1-5) | Score Bar |
|---|---|---|
| Dividend yield | 3 | |
| Dividend Stability | 4 | |
| Dividend Growth | 2 | |
| Payout ratio | 2 | |
| Financial stability | 2 | |
| Dividend continuity | 4 | |
| Cashflow Coverage | 3 | |
| Balance Sheet Quality | 2 |
Overall Score: 22/40
⭐ Rating
Microchip Technology continues to offer dividends with potential risks due to high leverage and payout concerns. Investors are advised to consider these factors for informed decision-making. Proceed with caution while the firm stabilizes its profitability and payout ratios.
Smart Data Insight
Master the Perfect Entry & Exit for this Stock
Don't leave your profits to chance. Historically, this stock follows specific seasonal patterns that institutional traders use to maximize returns.
- ✅ Identify the "Golden Buying Window"
- ✅ Avoid high-risk correction cycles
- ✅ Backtested data from the last 20+ years