May 15, 2026 a 08:15 am

MCD: Trend and Support & Resistance Analysis - McDonald's Corporation
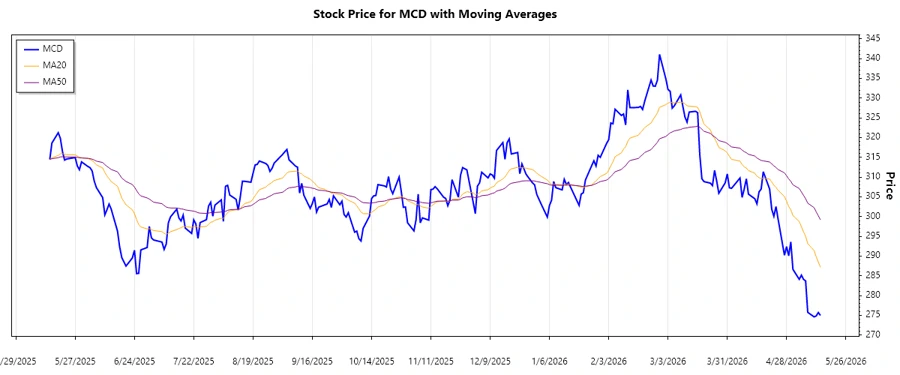
McDonald's Corporation, known for its vast global presence, continues to show dynamic price shifts in its stock. The current technical analysis highlights critical trends, alongside robust support and resistance zones, providing traders with actionable insights for potential investment strategies. With the latest price movements, investors are advised to consider both the opportunities and risks associated with the stock's trajectory.
Trend Analysis
| Date | Closing Price | Trend |
|---|---|---|
| 14 May 2026 | 274.97 | ▼ Downtrend |
| 13 May 2026 | 275.70 | ▼ Downtrend |
| 12 May 2026 | 274.84 | ▼ Downtrend |
| 11 May 2026 | 274.60 | ▲ Uptrend |
| 08 May 2026 | 275.75 | ▲ Uptrend |
| 07 May 2026 | 283.70 | ▲ Uptrend |
| 06 May 2026 | 284.10 | ▲ Uptrend |
Analysis of the EMAs indicates a downtrend, as EMA20 is below EMA50 during the latest observations. This suggests caution for short-term position holders while ensuring optimal stop-loss placements.
Support and Resistance
| Zone | From | To |
|---|---|---|
| Support 1 | 299.00 | 305.00 |
| Support 2 | 290.00 | 295.00 |
| Resistance 1 | 315.00 | 320.00 |
| Resistance 2 | 323.00 | 328.00 |
The current price is below the first support zone, indicating potential testing of deeper price territories. Investors should watch for price action cues near these zones to evaluate the strength or downward breach possibility.
Conclusion
McDonald's stock is showing a downward trend as observed with the current EMA placements. The support and resistance levels are crucial indicators to monitor for potential buying or selling opportunities. The stock trading below support indicates increased short-term risk, requiring vigilant observation for reversal signs. Continued downward price action may impact investor sentiment and require strategic reviews.
Smart Data Insight
Master the Perfect Entry & Exit for this Stock
Don't leave your profits to chance. Historically, this stock follows specific seasonal patterns that institutional traders use to maximize returns.
- ✅ Identify the "Golden Buying Window"
- ✅ Avoid high-risk correction cycles
- ✅ Backtested data from the last 20+ years