July 12, 2025 a 03:15 am


MCD: Trend and Support & Resistance Analysis - McDonald's Corporation
McDonald's Corporation, a global leader in the fast-food industry, continues to showcase resilience in its market performance. The recent price movements indicate notable trends that analysts and investors should closely monitor. This analysis will delve into both short-term and long-term trends, providing insight into potential investment strategies. Understanding the support and resistance levels can also guide future trading decisions.
Trend Analysis
| Date | Close Price | Trend |
|---|---|---|
| 2025-07-11 | $299.91 | ▼ |
| 2025-07-10 | $298.39 | ▼ |
| 2025-07-09 | $293.02 | ▼ |
| 2025-07-08 | $291.67 | ▼ |
| 2025-07-07 | $293.53 | ▼ |
| 2025-07-03 | $294.08 | ▼ |
| 2025-07-02 | $294.63 | ▼ |
The current trend is a downward movement as the EMA20 remains below the EMA50. This indicates a sustained bearish sentiment in the market. Investors should be cautious, as the stock is showing signs of weakness.
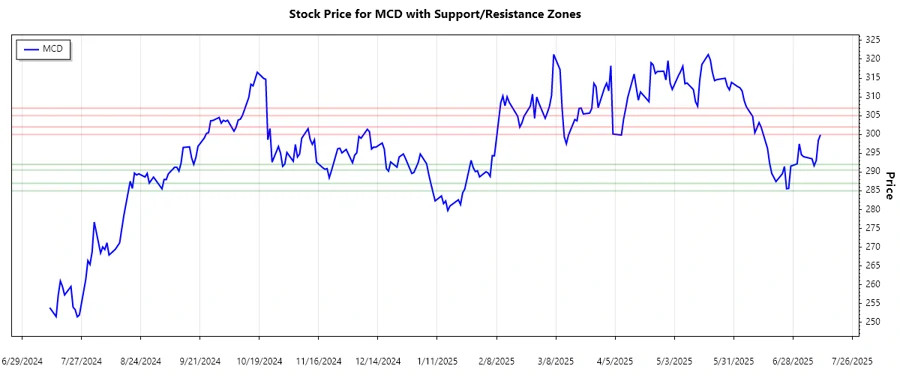
Support and Resistance
| Zone Type | Range |
|---|---|
| Support Zone 1 | 🔽 $290.50 - $292.00 |
| Support Zone 2 | 🔽 $285.00 - $287.00 |
| Resistance Zone 1 | 🔼 $300.00 - $302.00 |
| Resistance Zone 2 | 🔼 $305.00 - $307.00 |
Currently, the stock is trading close to the first support zone, indicating potential buying interest around this area. However, if the price breaks below, further declines may be expected.
Conclusion
The McDonald's Corporation (MCD) exhibits a bearish trend, with EMA indicators confirming the downtrend. The stock's proximity to support levels may attract buying, but caution is advised due to the overall weakness. Resistance levels suggest significant hurdles for upward movements. Short-term risk appears to outweigh potential gains unless a reversal signal emerges. Evaluating risk management strategies is crucial for investors considering positions in MCD.
Smart Data Insight
Master the Perfect Entry & Exit for this Stock
Don't leave your profits to chance. Historically, this stock follows specific seasonal patterns that institutional traders use to maximize returns.
- ✅ Identify the "Golden Buying Window"
- ✅ Avoid high-risk correction cycles
- ✅ Backtested data from the last 20+ years