May 11, 2026 a 10:15 am
MCD: Fibonacci Analysis - McDonald's Corporation
The recent data analysis for McDonald's Corporation (MCD) indicates a clear dominant downtrend in the stock price. Investors have observed a considerable decrease from the earlier period's highs. This decline poses certain opportunities for long-term investors but also highlights potential risks if broader market conditions worsen.
Fibonacci Analysis
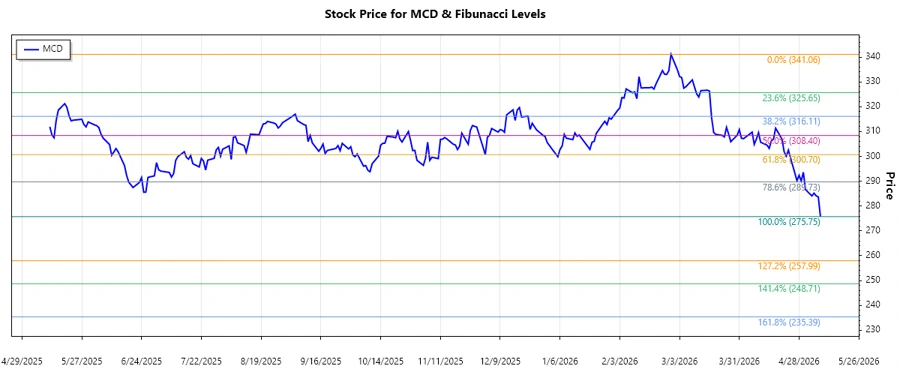
The analysis of McDonald's recent trend shows a noteworthy downward trajectory starting from early February. During this period, the stock reached its high at $341.06 and fell to a low of $275.75 by May. The retracement levels have been calculated based on these critical price points.
| Detail | Value |
|---|---|
| Trend Start Date | 2026-02-27 |
| Trend End Date | 2026-05-08 |
| High Price & Date | $341.06 (2026-02-27) |
| Low Price & Date | $275.75 (2026-05-08) |
| Fibonacci Level | Price Level |
|---|---|
| 0.236 | $287.78 |
| 0.382 | $299.21 |
| 0.5 | $308.41 |
| 0.618 | $317.61 |
| 0.786 | $330.53 |
The current price of $275.75 has not yet entered any significant retracement zone according to the calculated levels. As such, it is below the first 0.236 Fibonacci level. This indicates that the market sentiment remains bearish, with potential further decline unless a reversal is confirmed.
Technically, breaking back above the 0.236 level would be a positive sign indicating potential support, while dropping further suggests weak buying interest around current lows.
Conclusion
In conclusion, McDonald's Corporation's stock performance shows significant challenges given the existing downtrend. While Fibonacci levels suggest potential support, they also highlight the price's current positioning below any retracement zone. For analysts, this may predict further caution in the near-term market conditions unless positive catalysts emerge. However, any definitive breach of upper Fibonacci levels could suggest budding recovery opportunities, while persistent declines warrant strategic risk management approaches.
Smart Data Insight
Master the Perfect Entry & Exit for this Stock
Don't leave your profits to chance. Historically, this stock follows specific seasonal patterns that institutional traders use to maximize returns.
- ✅ Identify the "Golden Buying Window"
- ✅ Avoid high-risk correction cycles
- ✅ Backtested data from the last 20+ years