August 30, 2025 a 10:15 am
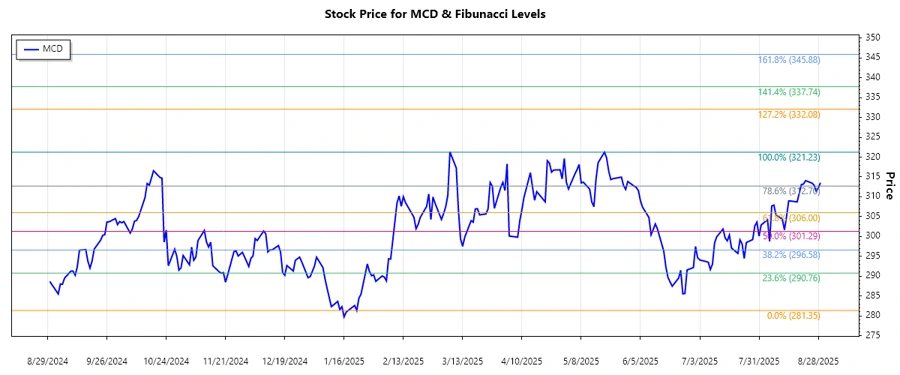
MCD: Fibonacci Analysis - McDonald's Corporation
McDonald's Corporation, a leader in the fast-food industry, has recently experienced an upward trend in its stock price, reflecting strong investor confidence. However, the potential for retracement exists as the market reacts to macroeconomic factors and competitive pressures. Analysts will be closely monitoring the price movements to identify key levels of support and resistance. Applying Fibonacci retracement may provide insights into potential price reversals or continuation patterns.
Fibonacci Analysis
| Start Date | End Date | High Price | High Date | Low Price | Low Date |
|---|---|---|---|---|---|
| 2024-10-22 | 2025-08-29 | 321.23 | 2025-05-19 | 281.35 | 2025-01-22 |
| Retracement Level | Price Level |
|---|---|
| 0.236 | 292.08 |
| 0.382 | 299.63 |
| 0.5 | 301.29 |
| 0.618 | 302.95 |
| 0.786 | 306.16 |
As of the latest price of $313.54, the current price lies outside the primary Fibonacci retracement zones, indicating a robust upward trend despite minor pullbacks and suggesting a potential continuation if the price sustains above critical levels.
The current situation shows a strong support level around the 0.382 (299.63) and 0.5 (301.29) retracement levels. Analysts could expect significant buying interest if prices dip to these zones.
Conclusion
In conclusion, the recent trend in McDonald's Corporation shares suggests promising growth potential, supported by bullish investor sentiment. However, given the market's volatility, investors should remain vigilant of critical price levels that could act as potential support or resistance. The upward trend has not entered significant retracement zones, indicating sustained bullish momentum. Nevertheless, any developments in the economic landscape or in industry competition could introduce risks that need careful analysis. For investors, understanding the Fibonacci levels aids in making informed decisions to capitalize on both the opportunities and risks present.