
June 04, 2026 a 03:31 am

MCD: Dividend Analysis - McDonald's Corporation
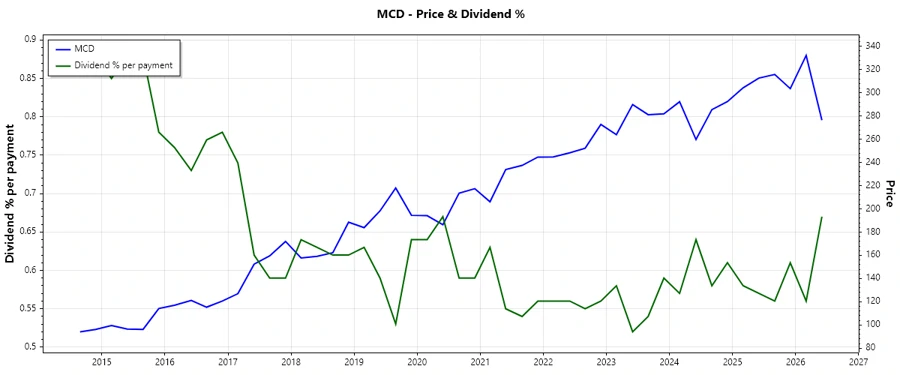
McDonald's Corporation stands out with a robust and long-standing dividend policy, reflected by over 51 consecutive years of dividend payments. Its current yield of 2.66% is particularly appealing for income-focused investors. With recent history indicating consistent growth, McDonald's dividend appears sustainable due to a strong market position and effective cost management strategies.
📊 Overview
Detailed assessment of McDonald's dividend profile reveals a solid history of payments, indicative of financial strength and commitment to shareholder returns.
| Attributes | Details |
|---|---|
| Sector | Consumer Discretionary |
| Dividend yield | 2.66% |
| Current dividend per share | 7.17 USD |
| Dividend history | 51 years |
| Last cut or suspension | None |
📈 Dividend History
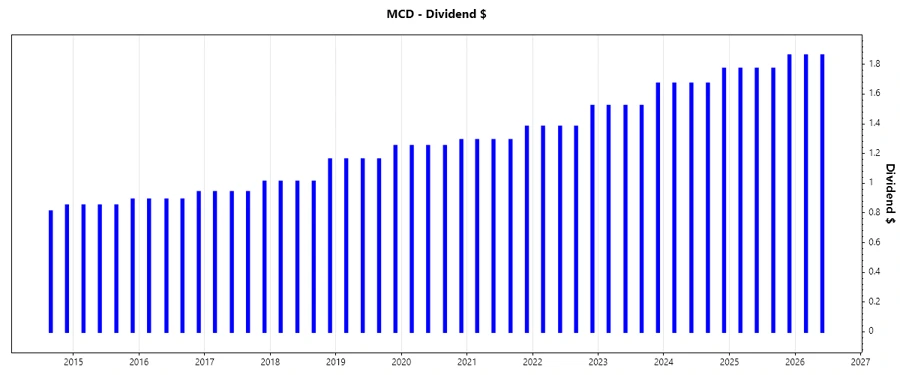
Analyzing the past dividend distributions provides insights into the company's commitment to delivering returns to shareholders. A consistent dividend payout signifies financial health and predictability in cash flows.
| Year | Dividend per share (USD) |
|---|---|
| 2026 | 3.72 |
| 2025 | 7.17 |
| 2024 | 6.78 |
| 2023 | 6.23 |
| 2022 | 5.66 |
📉 Dividend Growth
The analysis of dividend growth over specific periods illustrates the company's potential to enhance shareholder value through increasing returns. Sustainable growth is a positive indicator of financial management capability and strategic foresight.
| Time | Growth |
|---|---|
| 3 years | 8.20% |
| 5 years | 7.30% |
The average dividend growth is 7.30% over 5 years. This shows moderate but steady dividend growth.
✅ Payout Ratio
Payout ratios are critical metrics assessing the sustainability of dividends. They provide an indication of the company's ability to maintain its current payout levels amidst varying business cycles.
| Ratio | Value |
|---|---|
| EPS-based | 58.72% |
| Free cash flow-based | 72.37% |
With an EPS payout ratio of 58.72% and a FCF payout ratio of 72.37%, McDonald's is effectively balancing between reinvestment and rewarding shareholders, highlighting operational efficiency.
Cashflow & Capital Efficiency
An analysis of cash flow and capital efficiency metrics provides insight into a company's ability to generate cash and manage capital. These are key to ensuring sustainable operations and funding of dividends.
| Metric | 2025 | 2024 | 2023 |
|---|---|---|---|
| Free Cash Flow Yield | 3.30% | 3.20% | 3.36% |
| Earnings Yield | 3.93% | 3.95% | 3.92% |
| CAPEX to Operating Cash Flow | 31.89% | 29.37% | 24.53% |
| Stock-based Compensation to Revenue | 0% | 0.66% | 0.69% |
| Free Cash Flow/Operating Cash Flow Ratio | 68.11% | 70.63% | 75.47% |
McDonald's maintains strong cash flow efficiency, as evidenced by stable Free Cash Flow Yields and prudent capital management ratios, fostering continued dividend reliability.
Balance Sheet & Leverage Analysis
This section provides a detailed review of McDonald's balance sheet health and leverage metrics. A stable balance sheet is essential for handling economic downturns and sustaining dividend payments.
| Metric | 2025 | 2024 | 2023 |
|---|---|---|---|
| Debt-to-Equity | -30.62 | -13.68 | -11.28 |
| Debt-to-Assets | 92.10% | 94.14% | 94.56% |
| Debt-to-Capital | 103.38% | 107.88% | 109.73% |
| Net Debt to EBITDA | 3.69x | 3.65x | 3.50x |
| Current Ratio | 0.95 | 1.19 | 1.16 |
| Quick Ratio | 0.94 | 1.18 | 1.16 |
| Financial Leverage | -33.25 | -14.54 | -11.93 |
McDonald's leverage ratios indicate aggressive financial strategies, yet their coverage and liquidity remain consistent, revealing sound financial management practices.
Fundamental Strength & Profitability
Assessing fundamental strength and profitability metrics is pivotal in gauging McDonald's operational efficiency and profit generation capabilities, which directly impact shareholder value and dividend sustainability.
| Metric | 2025 | 2024 | 2023 |
|---|---|---|---|
| Return on Equity | -4.78% | -2.17% | -1.80% |
| Return on Assets | 14.39% | 14.90% | 15.08% |
| Margins: Net | 31.85% | 31.72% | 33.22% |
| Margins: EBIT | 46.42% | 45.72% | 46.61% |
| Margins: EBITDA | 54.44% | 53.81% | 54.37% |
| Margins: Gross | 57.41% | 56.75% | 57.12% |
| R&D to Revenue | 0% | 0% | 0% |
Despite negative returns on equity, McDonald's exhibits solid margins and returns on assets, suggesting efficient operations and resilience in maintaining profitability.
📈 Price Development
Dividend Scoring System
| Criterion | Score | Bar |
|---|---|---|
| Dividend yield | 4/5 | |
| Dividend Stability | 5/5 | |
| Dividend Growth | 3/5 | |
| Payout ratio | 4/5 | |
| Financial stability | 3/5 | |
| Dividend continuity | 5/5 | |
| Cashflow Coverage | 3/5 | |
| Balance Sheet Quality | 3/5 |
Total Score: 30/40
Rating
McDonald's dividend proposition remains attractive due to its high stability and consistent growth history. While financial leverage is high, the company's covering capabilities and efficient margins provide comfort. Recommended for income investors seeking dependable dividend streams with modest growth potential.
Smart Data Insight
Master the Perfect Entry & Exit for this Stock
Don't leave your profits to chance. Historically, this stock follows specific seasonal patterns that institutional traders use to maximize returns.
- ✅ Identify the "Golden Buying Window"
- ✅ Avoid high-risk correction cycles
- ✅ Backtested data from the last 20+ years