March 23, 2026 a 12:46 pm
MCD: Dividend Analysis - McDonald's Corporation
McDonald's Corporation exhibits a robust dividend profile with outstanding stability. With over half a century of consistent dividend payouts, the company stands as a fortress in dividend history, appealing to income-focused investors. The current yield and well-balanced payout ratios underpin its commitment to shareholder returns, while moderate dividend growth supports long-term value creation.
📊 Overview
McDonald's operates within the Consumer Discretionary sector and boasts a consistent dividend track record of 51 years, signifying strong shareholder value commitment. The current dividend yield of 2.19% and a per-share dividend of $7.17 further underscore its stable financial ecosystem.
| Metric | Value |
|---|---|
| Sector | Consumer Discretionary |
| Dividend Yield | 2.19% |
| Current Dividend per Share | 7.17 USD |
| Dividend History | 51 years |
| Last Cut or Suspension | None |
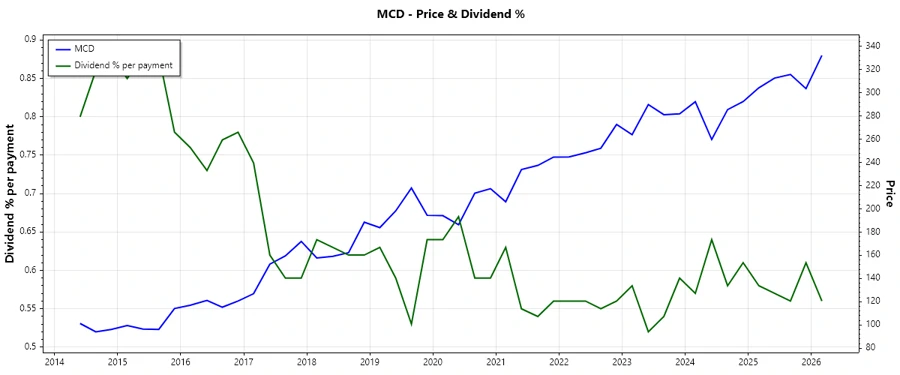
📈 Dividend History
McDonald's strong dividend history highlights its financial resilience and commitment to distributions, which is crucial for investor confidence and income stability.
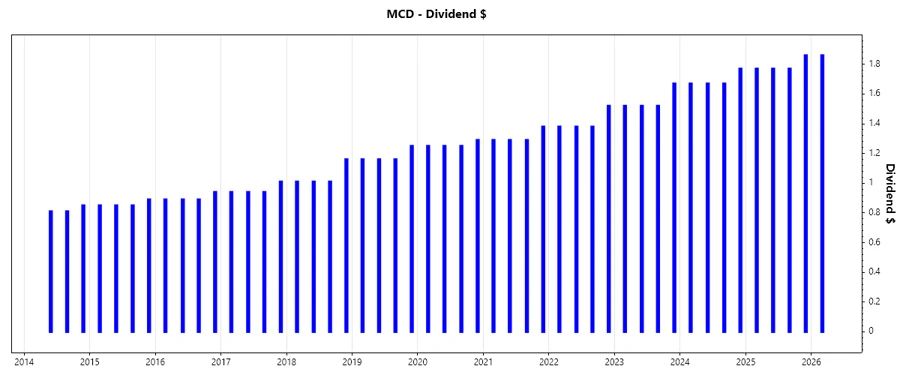
| Year | Dividend per Share (USD) |
|---|---|
| 2026 | 1.86 |
| 2025 | 7.17 |
| 2024 | 6.78 |
| 2023 | 6.23 |
| 2022 | 5.66 |
🌱 Dividend Growth
The growth in dividends signifies McDonald's ability to align shareholder returns with business performance, vital for maintaining investor interest and capital appreciation.
| Time | Growth |
|---|---|
| 3 years | 8.20% |
| 5 years | 7.30% |
The average dividend growth is 7.30% over 5 years. This shows moderate but steady dividend growth.
💹 Payout Ratio
Payout ratios provide insights into the sustainability of dividends by comparing earnings and free cash flow to dividend payments, ensuring that distributions are within financial means.
| Key Figure | Ratio |
|---|---|
| EPS-based | 59.80% |
| Free cash flow-based | 71.20% |
The EPS-based payout ratio of 59.80% and FCF-based ratio of 71.20% indicate a healthy coverage of dividends, signifying sustainability barring significant profit fluctuations.
💵 Cashflow & Capital Efficiency
Evaluating cash flow and capital efficiency is key to understanding McDonald's ability to generate and use cash effectively, essential for sustaining operations and dividends.
| Year | 2023 | 2024 | 2025 |
|---|---|---|---|
| Free Cash Flow Yield | 3.36% | 3.20% | 3.30% |
| Earnings Yield | 3.92% | 3.95% | 3.93% |
| CAPEX to Operating Cash Flow | 24.53% | 29.37% | 31.89% |
| Stock-based Compensation to Revenue | 0.68% | 0.66% | 0.48% |
| Free Cash Flow/Operating Cash Flow Ratio | 75.47% | 70.63% | 68.11% |
McDonald's exhibits strong cash flow stability and capital allocation efficiency, supporting its dividend strategy and ensuring available resources for reinvestment and distribution.
🗓️ Balance Sheet & Leverage Analysis
Analyzing balance sheet metrics helps assess McDonald's financial robustness, liquidity, and debt management strategies essential for operational continuity and minimizing risk.
| Year | 2023 | 2024 | 2025 |
|---|---|---|---|
| Debt-to-Equity | -11.28 | -13.68 | -30.62 |
| Debt-to-Assets | 94.56% | 94.14% | 92.10% |
| Debt-to-Capital | 109.73% | 107.88% | 103.38% |
| Net Debt to EBITDA | 3.50 | 3.65 | 3.69 |
| Current Ratio | 1.16 | 1.19 | 0.95 |
| Quick Ratio | 1.16 | 1.18 | 0.94 |
| Financial Leverage | -11.93 | -14.54 | -33.25 |
With its mixed debt metrics, McDonald's demonstrates a strategic balance between leveraging operations efficiently and maintaining market trust.
💪 Fundamental Strength & Profitability
Fundamental metrics offer insights into operational effectiveness, profitability, and return metrics, essential for gauging long-term performance sustenance.
| Year | 2023 | 2024 | 2025 |
|---|---|---|---|
| Return on Equity | -1.80% | -2.17% | -4.78% |
| Return on Assets | 15.08% | 14.90% | 14.39% |
| Net Margin | 33.22% | 31.72% | 31.85% |
| EBIT Margin | 46.61% | 45.72% | 46.42% |
| EBITDA Margin | 54.37% | 53.81% | 54.44% |
| Gross Margin | 57.12% | 56.75% | 57.41% |
| R&D to Revenue | 0.00% | 0.00% | 0.00% |
This robust profitability and efficiency profile positions McDonald's for sustained growth and shareholder value creation amidst its competitive landscape.
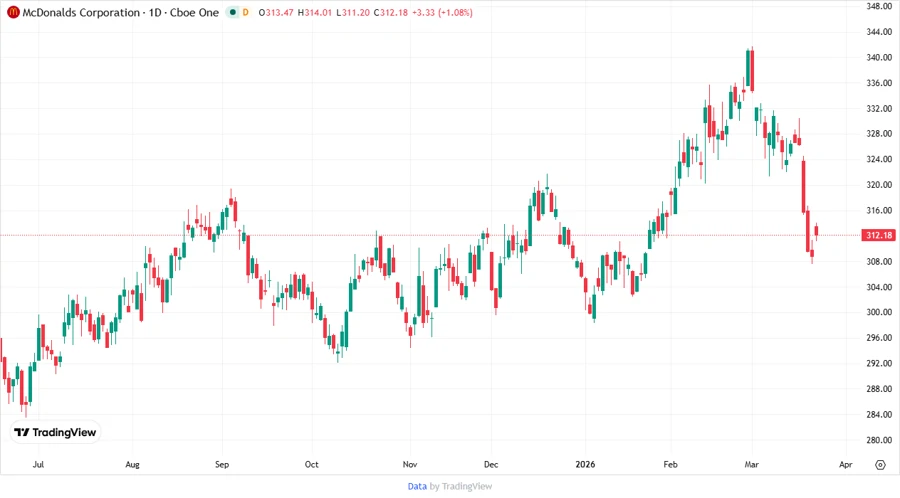
📉 Price Development
🏆 Dividend Scoring System
| Criteria | Score | Visual |
|---|---|---|
| Dividend Yield | 3 | |
| Dividend Stability | 5 | |
| Dividend Growth | 4 | |
| Payout Ratio | 4 | |
| Financial Stability | 4 | |
| Dividend Continuity | 5 | |
| Cashflow Coverage | 3 | |
| Balance Sheet Quality | 3 |
Total Score: 31/40
🔍 Rating
McDonald's Corporation exhibits a fundamentally strong dividend profile supported by stability and growth elements, making it a compelling choice for dividend-focused investors seeking consistent income and capital appreciation. The financial metrics affirm management's effective balancing of shareholder returns with operational investment, though attention is needed on leveraging practices. Overall, the corporation's proven dividend commitment positions it well for the future despite market dynamics.
Smart Data Insight
Master the Perfect Entry & Exit for this Stock
Don't leave your profits to chance. Historically, this stock follows specific seasonal patterns that institutional traders use to maximize returns.
- ✅ Identify the "Golden Buying Window"
- ✅ Avoid high-risk correction cycles
- ✅ Backtested data from the last 20+ years