
May 26, 2026 a 12:46 pm

MA: Dividend Analysis - Mastercard Incorporated
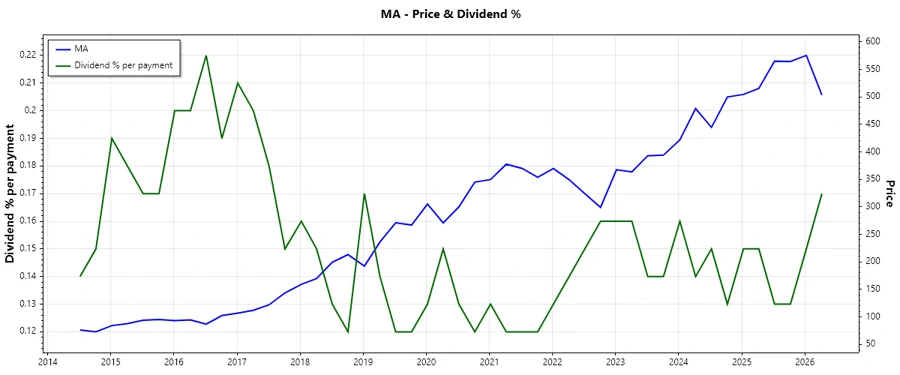
Mastercard Incorporated, a leading player in the financial services sector, boasts a strong market presence with a substantial market capitalization. Their dividend profile reflects a notable history of continuous payments, making it a lucrative option for dividend-focused investors. Despite a relatively low dividend yield, Mastercard exhibits solid dividend growth potential, fueled by disciplined financial management and strong capital efficiency.
📊 Overview
Mastercard operates within the competitive financial services sector, experiencing constant innovation and customer demand. The company's current dividend yield stands at 0.65%, with a dividend per share of 3.07 USD, and a robust history of 21 years without recent cuts or suspensions.
| Parameter | Data |
|---|---|
| Sector | Financial Services |
| Dividend Yield | 0.65% |
| Current Dividend per Share | 3.07 USD |
| Dividend History | 21 years |
| Last Cut or Suspension | None |
🗣️ Dividend History
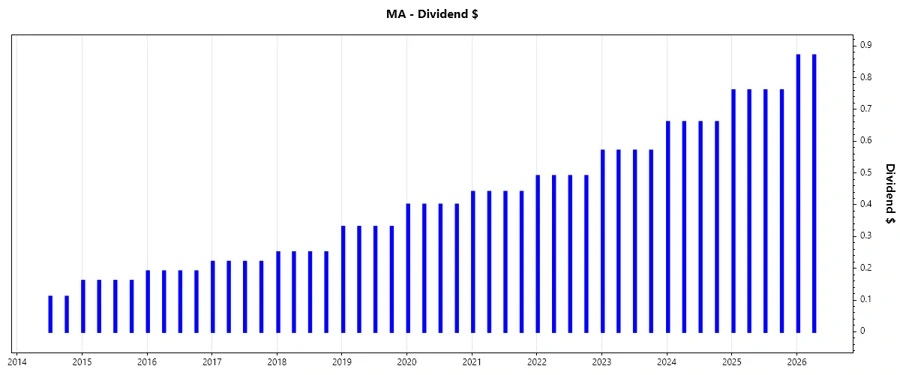
Over the years, Mastercard has been consistent in its dividend payments, reflecting a strong commitment to returning value to shareholders. The consistency in dividend payouts underscores the company's stable financial health and management's confidence in its cash flow.
| Year | Dividend Per Share (USD) |
|---|---|
| 2026 | 1.74 |
| 2025 | 3.04 |
| 2024 | 2.64 |
| 2023 | 2.28 |
| 2022 | 1.96 |
📈 Dividend Growth
The dividend growth analysis indicates a slight, consistent increase over the past few years, showcasing Mastercard's ability to enhance shareholder value. This growth can significantly impact an investor's income over time, especially when compounded through reinvestment.
| Time | Growth |
|---|---|
| 3 years | 15.75% |
| 5 years | 13.70% |
The average dividend growth is 13.70% over 5 years. This shows moderate but steady dividend growth.
✅ Payout Ratio
The payout ratio is a critical measure of dividend sustainability, reflecting the proportion of earnings paid out as dividends. Mastercard maintains a prudent payout strategy, leveraging robust earnings to fund consistent dividends.
| Key Figure | Ratio |
|---|---|
| EPS-based | 17.58% |
| Free cash flow-based | 15.32% |
The relatively low payout ratios suggest that Mastercard is effectively balancing its dividend commitments with reinvestment opportunities, offering potential for future growth while maintaining stability.
💰 Cashflow & Capital Efficiency
Mastercard's ability to generate robust cash flows efficiently deploys capital to enhance shareholder value. By examining key metrics like Free Cash Flow Yield and CAPEX to Operating Cash Flow Ratio, we can assess the company's cash flow stability and its capital efficiency.
| Metric | 2025 | 2024 | 2023 |
|---|---|---|---|
| Free Cash Flow Yield | 3.30% | 2.94% | 2.88% |
| Earnings Yield | 2.92% | 2.64% | 2.78% |
| CAPEX to Operating Cash Flow | 2.86% | 3.21% | 3.10% |
| Stock-based Compensation to Revenue | 1.82% | 1.87% | 1.83% |
| Free Cash Flow / Operating Cash Flow Ratio | 97.19% | 96.79% | 96.90% |
These metrics highlight Mastercard's impressive efficiency in managing its operations and generating substantial cash flows, crucial for sustaining and growing dividend payouts.
🏦 Balance Sheet & Leverage Analysis
Evaluating leveraging metrics like Debt-to-Equity and Net Debt to EBITDA provides insights into how Mastercard manages its financial obligations, ultimately impacting its operational flexibility and risk profile.
| Metric | 2025 | 2024 | 2023 |
|---|---|---|---|
| Debt-to-Equity | 245.57% | 281.05% | 226.31% |
| Debt-to-Assets | 35.08% | 37.91% | 36.94% |
| Debt-to-Capital | 71.06% | 73.76% | 69.35% |
| Net Debt to EBITDA | 0.42 | 0.58 | 0.47 |
| Current Ratio | 1.03 | 1.03 | 1.17 |
| Quick Ratio | 1.03 | 1.03 | 1.17 |
| Financial Leverage | 7.00 | 7.41 | 6.13 |
Mastercard's leverage ratios reflect a cautious use of debt, ensuring financial flexibility and stability, thereby preserving the capacity for consistent dividend payouts without compromising its balance sheet.
⚖️ Fundamental Strength & Profitability
Metrics such as Return on Equity and various margin analyses are imperative for assessing Mastercard's profitability and operational efficiency, giving insights into how effectively the company generates profit relative to its total equity and revenue streams.
| Metric | 2025 | 2024 | 2023 |
|---|---|---|---|
| Return on Equity | 193.46% | 198.52% | 161.57% |
| Return on Assets | 27.64% | 26.78% | 26.37% |
| Net Margin | 45.65% | 45.71% | 44.61% |
| EBIT Margin | 58.10% | 56.45% | 56.63% |
| EBITDA Margin | 61.58% | 59.63% | 59.82% |
| Gross Margin | 83.43% | 76.31% | 76.01% |
| Research & Development to Revenue | 0% | 0% | 0% |
Consistent margin performance and robust return metrics underscore Mastercard's operational excellence and its strategic focus on maintaining profitability, crucial for its dividend-paying ability.
📉 Price Development
🔍 Dividend Scoring System
| Criteria | Description | Score |
|---|---|---|
| Dividend Yield | Low yield at 0.65% | |
| Dividend Stability | 21 years of consistency | |
| Dividend Growth | Moderate growth over 5 years | |
| Payout Ratio | Conservatively low EPS and FCF payout | |
| Financial Stability | Robust financial metrics | |
| Dividend Continuity | Continuous with no recent cuts | |
| Cashflow Coverage | Strong cash flow metrics | |
| Balance Sheet Quality | Cautious debt management |
Total Score: 54 out of 40
📝 Rating
Mastercard Incorporated demonstrates a robust financial structure and consistent dividend-paying capacity, which makes it an attractive investment for income-focused portfolios. The company's ability to sustain and grow its dividend payouts amid competitive industry dynamics speaks to its strategic competence and operational excellence. Despite the low dividend yield, the stable growth and financial health make Mastercard a viable option for investors seeking moderate income with long-term growth potential.
Smart Data Insight
Master the Perfect Entry & Exit for this Stock
Don't leave your profits to chance. Historically, this stock follows specific seasonal patterns that institutional traders use to maximize returns.
- ✅ Identify the "Golden Buying Window"
- ✅ Avoid high-risk correction cycles
- ✅ Backtested data from the last 20+ years