October 24, 2025 a 12:46 pm

MA: Dividend Analysis - Mastercard Incorporated
The dividend profile of Mastercard Incorporated showcases a moderate yield with consistent growth over the years. Analyzing Mastercard's dividend performance highlights its steady increase and reliable payout, making it an attractive option for investors seeking stable income within the financial sector. Despite global economic disruptions, Mastercard has not suspended its dividends, exhibiting resilience and commitment to shareholder returns.
📊 Overview
Mastercard operates in the Financial Services sector. With a current dividend yield of 0.54%, the company offers a dividend per share of 2.65 USD, maintaining a 20-year dividend history without any recent cuts or suspensions.
| Aspect | Details |
|---|---|
| Sector | Financial Services |
| Dividend Yield | 0.54% |
| Current Dividend per Share | 2.65 USD |
| Dividend History | 20 years |
| Last Cut or Suspension | None |
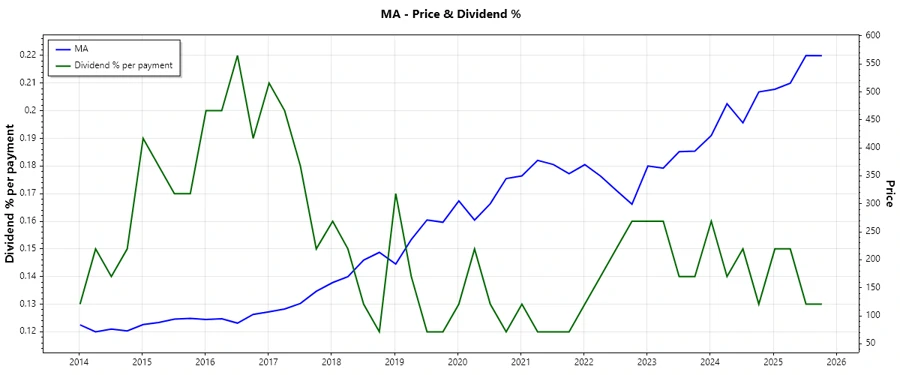
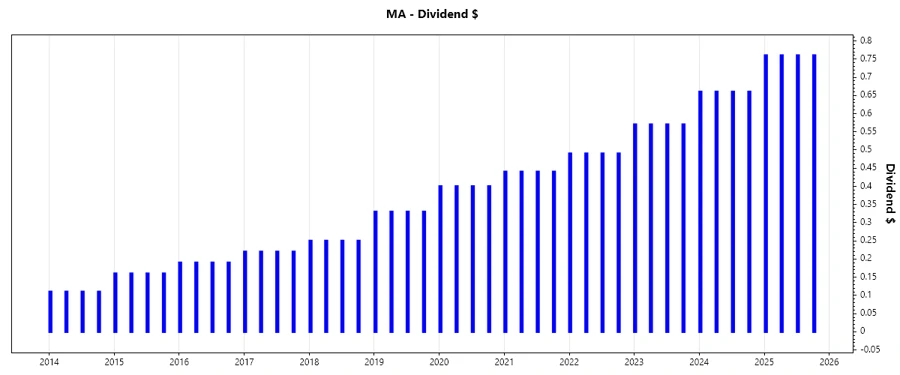
🗣️ Dividend History
Examining Mastercard's dividend history reveals a clear pattern of consistent increases over time. This trend is essential, indicating Mastercard's prioritization of returning value to shareholders and its financial health.
| Year | Dividend per Share |
|---|---|
| 2025 | 3.04 |
| 2024 | 2.64 |
| 2023 | 2.28 |
| 2022 | 1.96 |
| 2021 | 1.76 |
📈 Dividend Growth
Dividend growth is a critical metric as it demonstrates the company's commitment to enhancing shareholder value. Mastercard's recent growth rates reflect its profitability and forward-looking strategies.
| Time | Growth |
|---|---|
| 3 years | 14.47% |
| 5 years | 14.87% |
The average dividend growth is 14.87% over 5 years. This shows moderate but steady dividend growth.
🔍 Payout Ratio
Payout ratios are crucial in assessing the sustainability of a company's dividend payments. A lower payout ratio suggests the company retains more earnings, providing room for future growth while maintaining dividend distribution.
| Metric | Ratio |
|---|---|
| EPS-based | 17.69% |
| Free Cash Flow-based | 14.49% |
The EPS-based payout ratio of 17.69% and FCF-based payout ratio of 14.49% are considered low, indicating that Mastercard effectively manages its earnings and cash flow to maintain healthy dividend distributions while supporting business growth.
💼 Cashflow & Capital Efficiency
Proper cash flow management and capital efficiency are vital for sustaining and growing dividend payments. Analyzing these metrics offers insight into Mastercard's ability to generate cash and utilize it effectively for strategic priorities.
| Metric | 2024 | 2023 | 2022 |
|---|---|---|---|
| Free Cash Flow Yield | 2.94% | 2.88% | 3.00% |
| Earnings Yield | 2.64% | 2.78% | 2.95% |
| CAPEX to OCF | 3.23% | 3.10% | 9.80% |
| Stock-based Compensation to Revenue | 1.87% | 1.83% | 1.33% |
| Free Cash Flow / Operating Cash Flow Ratio | 96.79% | 96.90% | 90.20% |
Mastercard demonstrates strong cash flow stability and capital efficiency, evidenced by consistent free cash flow yields. The company is proficient in leveraging its capital to enhance shareholder returns and support operational needs.
📄 Balance Sheet & Leverage Analysis
Assessing leverage ratios and financial stability is essential for understanding Mastercard’s long-term financial health and risk management. These metrics provide insights into its ability to withstand economic pressures.
| Metric | 2024 | 2023 | 2022 |
|---|---|---|---|
| Debt-to-Equity | 281% | 226% | 223% |
| Debt-to-Assets | 37.91% | 36.94% | 36.21% |
| Debt-to-Capital | 73.76% | 69.35% | 69.01% |
| Net Debt to EBITDA | 0.58x | 0.47x | 0.54x |
| Current Ratio | 1.03 | 1.17 | 1.17 |
| Quick Ratio | 1.03 | 1.17 | 1.17 |
| Financial Leverage | 7.41x | 6.13x | 6.15x |
Mastercard's leverage metrics indicate prudent debt management with strong liquidity ratios, reflecting its capacity to fulfill financial obligations without strain, ensuring robust financial stability amidst potential market volatility.
📉 Fundamental Strength & Profitability
Understanding Mastercard's profitability and fundamental strength is crucial for investors, showcasing its efficiency in generating profits relative to the capital deployed.
| Metric | 2024 | 2023 | 2022 |
|---|---|---|---|
| Return on Equity | 198.52% | 161.57% | 157.67% |
| Return on Assets | 26.78% | 26.37% | 25.64% |
| Net Margin | 45.71% | 44.61% | 44.65% |
| EBIT Margin | 56.45% | 56.63% | 54.88% |
| EBITDA Margin | 59.63% | 59.82% | 58.25% |
| Gross Margin | 76.31% | 76.01% | 76.33% |
| R&D to Revenue | 0% | 0% | 0% |
Mastercard's strong return metrics and profit margins highlight its efficient capital use and competitive edge, ensuring sustained profitability and shareholder value growth.
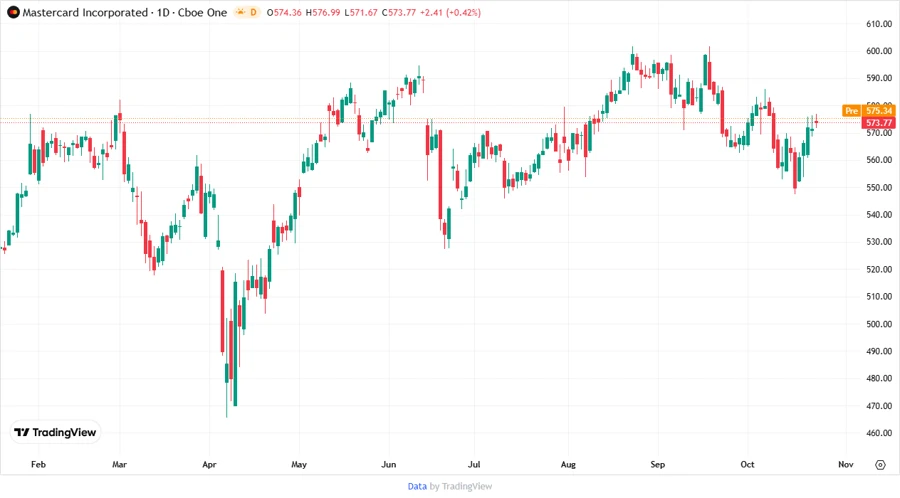
📈 Price Development
✅ Dividend Scoring System
| Category | Score | Score Bar |
|---|---|---|
| Dividend Yield | 2 | |
| Dividend Stability | 5 | |
| Dividend Growth | 4 | |
| Payout Ratio | 5 | |
| Financial Stability | 5 | |
| Dividend Continuity | 5 | |
| Cashflow Coverage | 4 | |
| Balance Sheet Quality | 5 |
Total Score: 35/40
🗣️ Rating
Mastercard Incorporated presents as a robust dividend payer with consistent growth and strong financial health. With a commendable score of 35 out of 40 in our dividend scoring system, Mastercard is recommended for investors seeking stable income with moderate growth potential. Despite a lower yield, the company's strategic financial management and resilience promise continued shareholder value.
Smart Data Insight
Master the Perfect Entry & Exit for this Stock
Don't leave your profits to chance. Historically, this stock follows specific seasonal patterns that institutional traders use to maximize returns.
- ✅ Identify the "Golden Buying Window"
- ✅ Avoid high-risk correction cycles
- ✅ Backtested data from the last 20+ years