August 30, 2025 a 07:32 am

MA: Dividend Analysis - Mastercard Incorporated
This analysis provides a detailed insight into Mastercard's dividend profile, a vital aspect for shareholders focusing on income generation. Despite a modest dividend yield, Mastercard demonstrates significant resilience and growth in its dividend history, appealing to long-term dividend investors. The company's strategic approach to balancing payout ratios and reinvestment in growth opportunities makes it a compelling stock in the financial sector.
Overview 📊
Mastercard's dividend profile is robust, characterized by long-standing stability and moderate growth, affirming its commitment to shareholders.
| Metric | Value |
|---|---|
| Sector | Financial Services |
| Dividend Yield | 0.52% |
| Current Dividend Per Share | 2.65 USD |
| Dividend History | 20 years |
| Last Cut/Suspension | None |
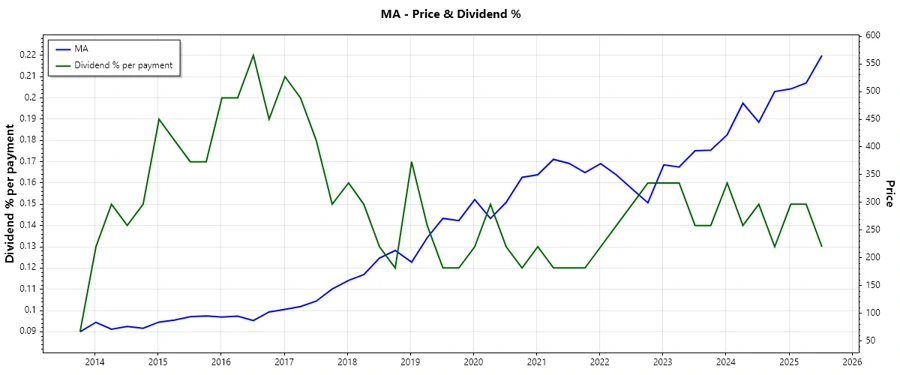
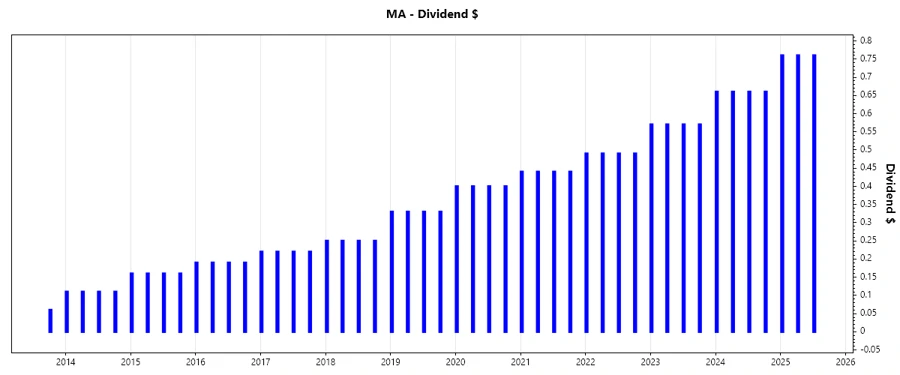
Dividend History 🗣️
The consistency of Mastercard's dividend payments over the years underlines its commitment to providing shareholder value. It's crucial for assessing the reliability of regular income.
| Year | Dividend Per Share (USD) |
|---|---|
| 2025 | 2.28 |
| 2024 | 2.64 |
| 2023 | 2.28 |
| 2022 | 1.96 |
| 2021 | 1.76 |
Dividend Growth 📈
Analyzing dividend growth is essential for understanding potential future income growth from investments in Mastercard.
| Time | Growth |
|---|---|
| 3 years | 14.47% |
| 5 years | 14.87% |
The average dividend growth is 14.87% over 5 years. This shows moderate but steady dividend growth.
Payout Ratio ✅
Payout ratios indicate how well earnings support dividend payments, key in determining sustainability.
| Payout Ratio Type | Value |
|---|---|
| EPS-based | 17.69% |
| Free Cash Flow-based | 14.49% |
Mastercard's low EPS (17.69%) and Free Cash Flow (14.49%) payout ratios suggest a conservative dividend policy, allowing room for future growth and resilience under varied economic conditions.
Cashflow & Capital Efficiency 🧾
Understanding cashflow dynamics and capital efficiency is instrumental in analyzing MasterCard's financial health and strategic capital allocation.
| Metric | 2024 | 2023 | 2022 |
|---|---|---|---|
| Free Cash Flow Yield | 2.94% | 2.88% | 3.00% |
| Earnings Yield | 2.64% | 2.78% | 2.95% |
| CAPEX to Operating Cash Flow | 3.21% | 3.10% | 9.80% |
| Stock-based Compensation to Revenue | 1.87% | 1.83% | 1.33% |
| Free Cash Flow / Operating Cash Flow Ratio | 96.79% | 96.90% | 90.20% |
Cash flow metrics indicate strong operational cash generation, supported by efficient capital expenditure, promising long-term capital allocation and shareholder returns.
Balance Sheet & Leverage Analysis 💪
Evaluating balance sheet metrics highlights Mastercard's leverage and overall financial health.
| Metric | 2024 | 2023 | 2022 |
|---|---|---|---|
| Debt-to-Equity | 2.81 | 2.26 | 2.23 |
| Debt-to-Assets | 0.38 | 0.37 | 0.36 |
| Debt-to-Capital | 0.74 | 0.69 | 0.69 |
| Net Debt to EBITDA | 0.58 | 0.47 | 0.54 |
| Current Ratio | 1.03 | 1.17 | 1.17 |
| Quick Ratio | 1.03 | 1.17 | 1.17 |
| Financial Leverage | 7.41 | 6.13 | 6.15 |
High leverage ratios indicate significant but managed debt, balanced by strong liquidity ratios that assure confidence in financial stability.
Fundamental Strength & Profitability 💼
Mastercard's profitability metrics are indicative of its competitive edge in the financial industry.
| Metric | 2024 | 2023 | 2022 |
|---|---|---|---|
| Return on Equity | 198.52% | 161.57% | 157.67% |
| Return on Assets | 26.78% | 26.37% | 25.64% |
| Net Profit Margin | 45.71% | 44.61% | 44.66% |
| EBIT Margin | 56.45% | 56.63% | 54.88% |
| R&D to Revenue | 0% | 0% | 0% |
Strong profitability ratios highlight Mastercard's effective operations and market position, critically enhancing shareholder value while minimizing cost inefficiencies.
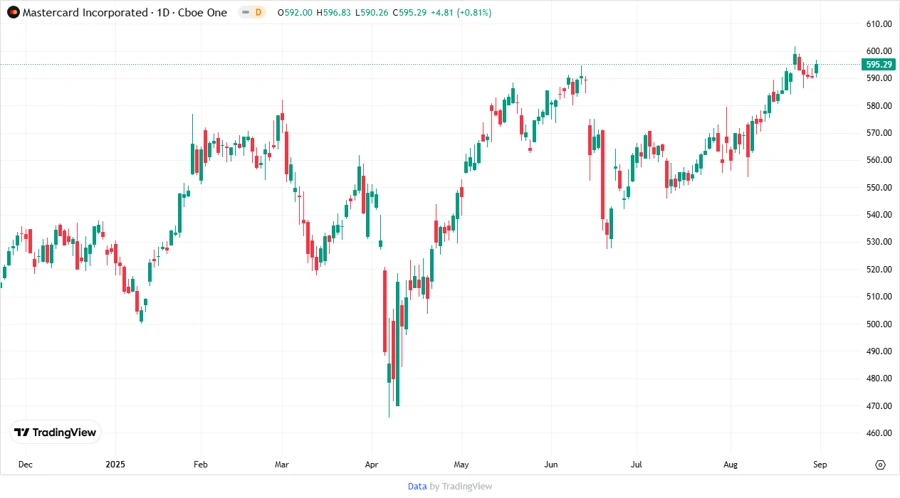
Price Development 📉
Dividend Scoring System 🏆
| Category | Score | Rating |
|---|---|---|
| Dividend Yield | 3 | |
| Dividend Stability | 5 | |
| Dividend Growth | 4 | |
| Payout Ratio | 5 | |
| Financial Stability | 4 | |
| Dividend Continuity | 5 | |
| Cashflow Coverage | 4 | |
| Balance Sheet Quality | 4 |
Total Score: 34/40
Rating ⭐
Mastercard holds a strong position with stable and growing dividends, supported by sound financial practices and metrics. It's recommended for investors seeking long-term, stable dividend income amidst a solid growth strategy in the financial services sector.
Smart Data Insight
Master the Perfect Entry & Exit for this Stock
Don't leave your profits to chance. Historically, this stock follows specific seasonal patterns that institutional traders use to maximize returns.
- ✅ Identify the "Golden Buying Window"
- ✅ Avoid high-risk correction cycles
- ✅ Backtested data from the last 20+ years