August 29, 2025 a 02:03 pm
MAS: Trend and Support & Resistance Analysis - Masco Corporation
Masco Corporation, a leader in building products, shows a complex stock behavior over recent months. The analysis of the MAS stock reveals crucial insights into its trend dynamics and potential trading zones. When assessing the technical indicators, it indicates a market position that could inform strategic trading decisions. Understanding these extracted patterns is essential for interpreting potential future movements and making informed investment choices.
Trend Analysis
| Date | Close Price | Trend |
|---|---|---|
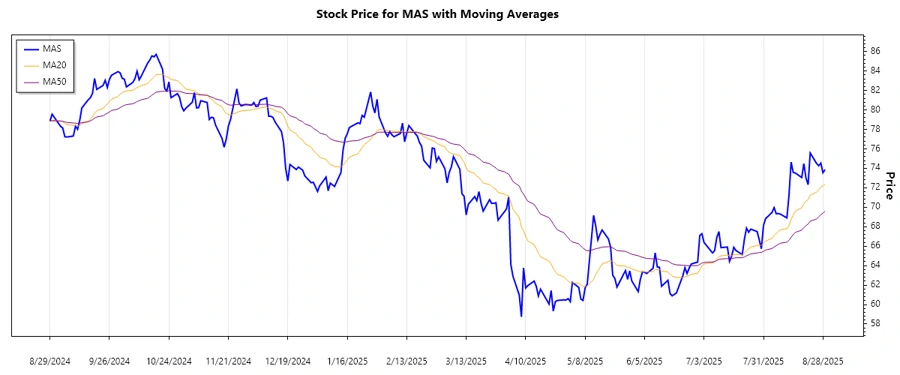
| 2025-08-29 | 73.87 | ▲ Uptrend |
| 2025-08-28 | 73.55 | ▲ Uptrend |
| 2025-08-27 | 74.54 | ▲ Uptrend |
| 2025-08-26 | 74.26 | ▲ Uptrend |
| 2025-08-25 | 74.5 | ▲ Uptrend |
| 2025-08-22 | 75.58 | ▲ Uptrend |
| 2025-08-21 | 72.32 | ▼ Downtrend |
Analysis of the past seven days indicates a dominant positive market movement, except for a noticeable drop on August 21st. The EMA20 crossing above the EMA50 after this decline suggests the potential resumption of an uptrend, pointing towards bullish sentiment.
Support- and Resistance
| Zone Type | Range |
|---|---|
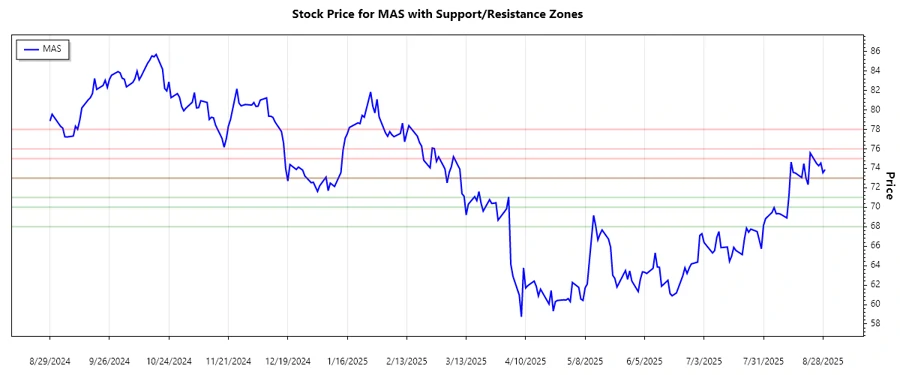
| Resistance | 76.00 - 78.00 ▲ |
| Resistance | 73.00 - 75.00 ▲ |
| Support | 71.00 - 73.00 ▼ |
| Support | 68.00 - 70.00 ▼ |
The latest price action shows that the MAS stock is approaching the lower resistance zone between $73-$75, indicating a possible short-term challenge to break upward. If the current trajectory holds, we could see attempts to test higher resistance levels.
Conclusion
Masco Corporation's current stock analysis indicates a promising uptrend, bolstered by EMA indicators. Current resistance levels may challenge upward progress but provide potential breakout opportunities. Support levels offer a cushion against downward pressure, mitigating risk. This dynamic environment holds potential rewards for strategic investors, provided they navigate volatility carefully.
Smart Data Insight
Master the Perfect Entry & Exit for this Stock
Don't leave your profits to chance. Historically, this stock follows specific seasonal patterns that institutional traders use to maximize returns.
- ✅ Identify the "Golden Buying Window"
- ✅ Avoid high-risk correction cycles
- ✅ Backtested data from the last 20+ years