
May 27, 2026 a 04:44 pm
MAS: Fibonacci Analysis - Masco Corporation
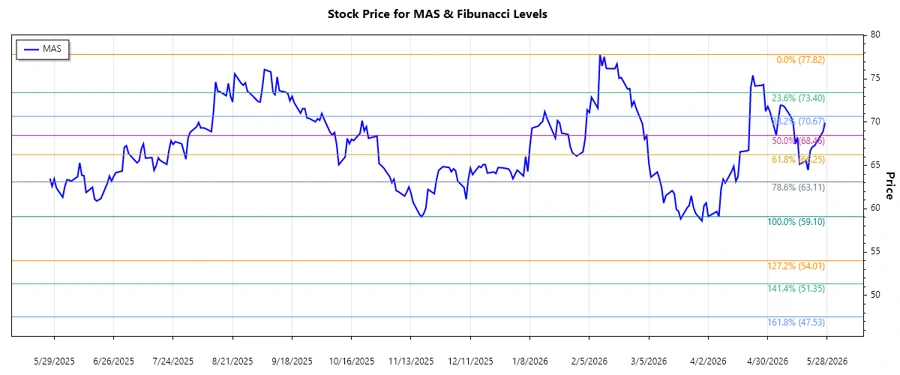
Masco Corporation has shown notable price movement over the analyzed period. As a major player in the home improvement and building products sector, the stock's recent performance aligns with industry trends. Recent historical data indicates a prevailing downtrend, offering potential entry points for investors monitoring Fibonacci retracement levels.
Fibonacci Analysis
| Trend Data | |
|---|---|
| Start Date | 2026-02-03 |
| End Date | 2026-05-27 |
| High Price (Date) | 78.82 (2026-02-10) |
| Low Price (Date) | 59.1 (2026-04-07) |
| Fibonacci Level | Price Level |
|---|---|
| 0.236 | 64.76 |
| 0.382 | 66.88 |
| 0.5 | 68.96 |
| 0.618 | 71.04 |
| 0.786 | 73.63 |
The current price is around 69.935, suggesting that it is within the 0.5 Fibonacci retracement area. This level could serve as a potential resistance point based on historical support patterns observed in technical analysis.
Conclusion
Masco Corporation's stock has been affected by a downward trend over recent months. The stock's position within the 0.5 Fibonacci retracement level suggests that it may face resistance. However, with its strong brand presence and ongoing innovations, there's potential for upward momentum. Analysts should be cautious yet observant of industry shifts and company performance metrics. The trend provides an opportunity for strategic investment decisions aligned with potential reversal or continuation patterns.
Smart Data Insight
Master the Perfect Entry & Exit for this Stock
Don't leave your profits to chance. Historically, this stock follows specific seasonal patterns that institutional traders use to maximize returns.
- ✅ Identify the "Golden Buying Window"
- ✅ Avoid high-risk correction cycles
- ✅ Backtested data from the last 20+ years