April 29, 2026 a 05:15 am
MAS: Fibonacci Analysis - Masco Corporation
Masco Corporation has shown resilience in the home improvement sector, with its diverse range of products and international presence. Recent trends in its stock price reflect economic conditions and market sentiment in the building products industry. A technical analysis reveals potential key levels for investors to consider, based on Fibonacci retracement levels. This could signal opportunities for entry or exit based on market movements.
Fibonacci Analysis
| Trend Analysis | Details |
|---|---|
| Trend Start Date | 2025-11-18 |
| Trend End Date | 2026-04-28 |
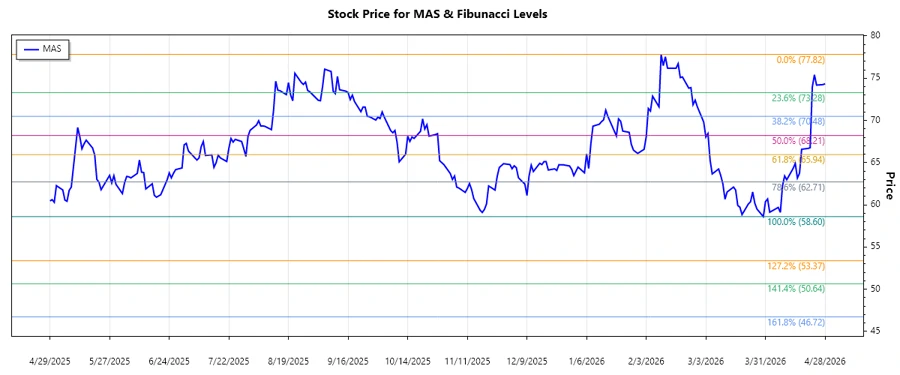
| High Price and Date | $77.82 on 2026-02-10 |
| Low Price and Date | $58.60 on 2026-03-30 |
Fibonacci Retracement Levels
| Level | Price |
|---|---|
| 0.236 | $65.36 |
| 0.382 | $68.26 |
| 0.5 | $70.73 |
| 0.618 | $73.20 |
| 0.786 | $76.02 |
The current price is $74.34, which places it in the 0.618 retracement zone. This suggests a potential resistance level, and investors should watch for trading activity around this price range.
Conclusion
In summary, Masco Corporation's stock is navigating a complex market environment with mixed signals. The recent price increase towards the 0.618 Fibonacci level indicates possible resistance, aligning with technical traders' expectations. Investors need to weigh the firm's solid market position against potential macroeconomic risks. A careful watch on industry trends and quarterly earnings will be crucial for making informed investment decisions in this sector.