May 12, 2026 a 02:46 am
MAS: Dividend Analysis - Masco Corporation
Masco Corporation remains a stalwart in the dividend landscape, showcasing a robust history of consistent payouts. With a market capitalization exceeding $14 billion and a commendable track record spanning over four decades, Masco's fiscal resilience and commitment to shareholders stand evident. Despite its fluctuating return metrics, the company boasts a moderate yet steady dividend growth, rendering it an attractive prospect for dividend-focused investors.
📊 Overview
Masco Corporation, a key player in the home improvement and building products sector, currently offers a dividend yield of 1.66%. Its current dividend per share stands at $1.25, backed by an impressive 44-year history of dividend payments, free from any recent cuts or suspensions.
| Metric | Details |
|---|---|
| Sector | Home Improvement & Building Products |
| Dividend yield | 1.66% |
| Current dividend per share | $1.25 |
| Dividend history | 44 years |
| Last cut or suspension | None |
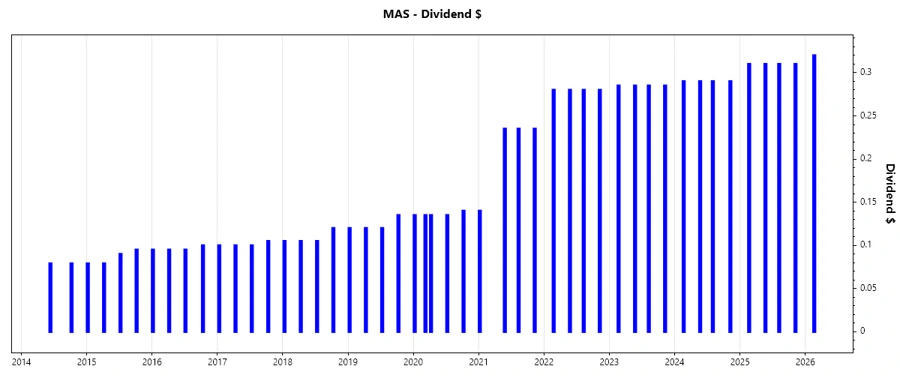
🗣️ Dividend History
Understanding the consistency of dividend payments is crucial for assessing a company's commitment to returning capital to shareholders. Masco has shown unwavering dedication with no interruptions in its 44-year tenure, highlighting its fiscal discipline and shareholder value prioritization.
| Year | Dividend per Share (USD) |
|---|---|
| 2026 | 0.32 |
| 2025 | 1.24 |
| 2024 | 1.16 |
| 2023 | 1.14 |
| 2022 | 1.12 |
📈 Dividend Growth
Dividend growth analysis provides insight into potential future income streams for investors. Masco's average dividend growth rate over five years is 12.77%, suggesting steady incremental increases in shareholder returns.
| Time | Growth |
|---|---|
| 3 years | 3.45% |
| 5 years | 12.77% |
The average dividend growth is 12.77% over 5 years. This shows moderate but steady dividend growth.
⚠️ Payout Ratio
The payout ratio is a key indicator of sustainability. Masco’s EPS-based payout ratio is 30.27%, and the FCF-based ratio is 26.72%, indicating a conservative approach. Such ratios reflect a secure dividend payout capacity, providing ample room for future increases.
| Key figure | Ratio |
|---|---|
| EPS-based | 30.27% |
| Free cash flow-based | 26.72% |
✅ Cashflow & Capital Efficiency
Reviewing cash flow yields and capital efficiency metrics helps evaluate financial flexibility and resource utilization. Masco's strong free cash flow yield and efficient cash flow management bolster its ability to sustain dividend payouts while maintaining operational growth.
| Metric | 2023 | 2024 | 2025 |
|---|---|---|---|
| Free Cash Flow Yield | 7.76% | 5.73% | 6.53% |
| Earnings Yield | 6.03% | 5.20% | 6.11% |
| CAPEX to Operating Cash Flow | 17.20% | 15.63% | 15.26% |
| Stock-based Compensation to Revenue | 0% | 0% | 0% |
| Free Cash Flow / Operating Cash Flow Ratio | 82.80% | 84.37% | 84.74% |
Masco demonstrates effective capital management, achieving healthy free cash flow margins and efficient cash flow utilization.
📉 Balance Sheet & Leverage Analysis
A detailed analysis of leverage ratios provides insight into the company’s debt management and overall financial risk. Masco's leverage metrics signal a challenging debt management scenario but highlight strategic fiscal management in other areas.
| Metric | 2023 | 2024 | 2025 |
|---|---|---|---|
| Debt-to-Equity | -25.80 | -11.48 | -18.47 |
| Debt-to-Assets | 60.62% | 64.07% | 66.06% |
| Debt-to-Capital | 104.03% | 109.54% | 105.72% |
| Net Debt to EBITDA | 1.75 | 1.83 | 2.02 |
| Current Ratio | 1.68 | 1.75 | 1.81 |
| Quick Ratio | 1.08 | 1.15 | 1.14 |
| Financial Leverage | -42.56 | -17.91 | -27.96 |
Though the company displays high leverage ratios, its quick and current ratios indicate liquidity in covering short-term liabilities.
✅ Fundamental Strength & Profitability
This analysis evaluates profitability and operational efficiency. Although profitability metrics show volatility, Masco's investment in growth areas supports its long-term value proposition.
| Metric | 2023 | 2024 | 2025 |
|---|---|---|---|
| Return on Equity | -7.21% | -2.94% | -4.35% |
| Return on Assets | 16.93% | 16.39% | 15.57% |
| ROIC | 27.89% | 29.49% | 26.15% |
| Net Margin | 11.40% | 10.50% | 10.71% |
| Gross Margin | 35.21% | 36.25% | 35.53% |
| EBIT Margin | 16.87% | 16.10% | 16.34% |
| EBITDA Margin | 18.74% | 18.01% | 18.30% |
| R&D to Revenue | 0% | 0% | 0% |
Despite fluctuations in return rates, the company continues to maintain a strong position by focusing on efficiency and leveraging innovation.
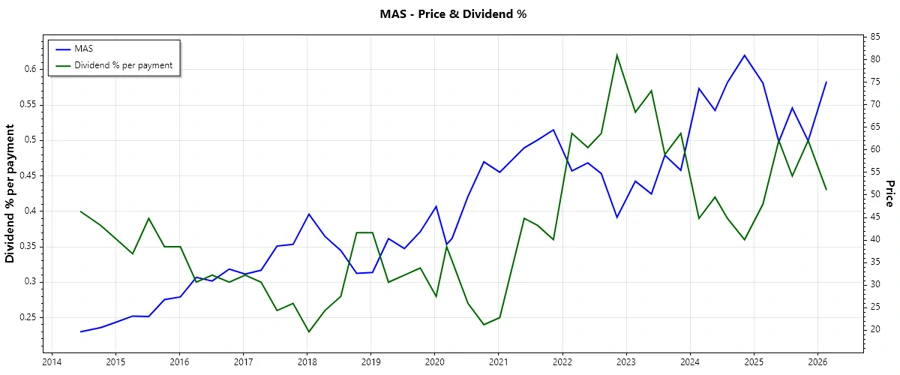
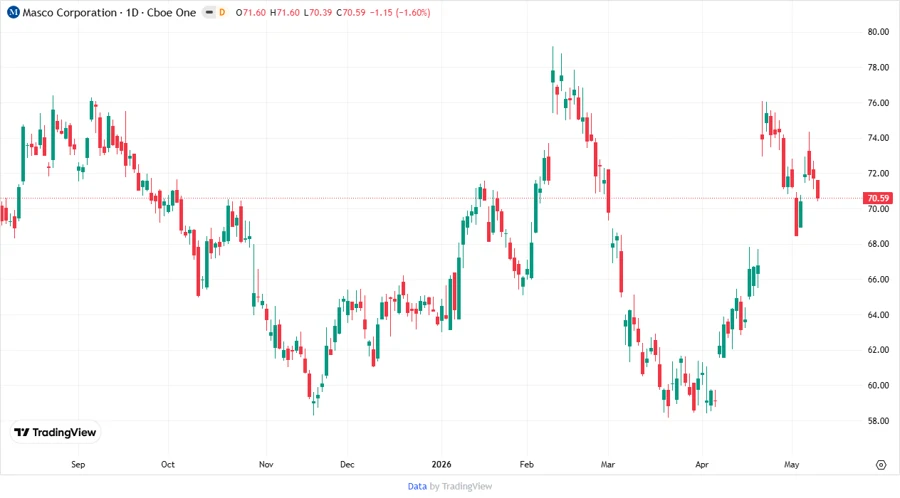
📈 Price Development
📊 Dividend Scoring System
| Criterion | Score | Visual |
|---|---|---|
| Dividend yield | 3 | |
| Dividend Stability | 5 | |
| Dividend growth | 4 | |
| Payout ratio | 4 | |
| Financial stability | 3 | |
| Dividend continuity | 5 | |
| Cashflow Coverage | 4 | |
| Balance Sheet Quality | 2 |
Overall Score: 30/40
🗣️ Rating
Overall, Masco Corporation provides a compelling dividend profile due to its consistent dividend payout history and steady growth rate. Despite some volatility in financial metrics, its strategic operations and conservative payout ratios position it as a reliable choice for dividend-seeking investors. Further potential enhancements in leverage and profitability could catalyze future dividend scalability. Hence, maintaining a portfolio position in Masco is advisable for risk-averse, income-focused investment strategies.
Smart Data Insight
Master the Perfect Entry & Exit for this Stock
Don't leave your profits to chance. Historically, this stock follows specific seasonal patterns that institutional traders use to maximize returns.
- ✅ Identify the "Golden Buying Window"
- ✅ Avoid high-risk correction cycles
- ✅ Backtested data from the last 20+ years