February 02, 2026 a 12:46 pm
MAS: Dividend Analysis - Masco Corporation
Masco Corporation's dividend profile highlights its steady dividend history with a current yield slightly above the industry average. Despite historical volatility, its commitment to consistent payouts and substantial growth over the past five years shows a positive trajectory for income-focused investors. However, financial stability metrics must be closely monitored given recent leverage indications.
📊 Overview
The following table offers a snapshot of Masco Corporation's key dividend metrics, providing insights into its sector performance and dividend credibility.
| Metric | Detail |
|---|---|
| Sector | Building Products |
| Dividend yield | 2.00 % |
| Current dividend per share | 1.17 USD |
| Dividend history | 43 years |
| Last cut or suspension | 2010 |
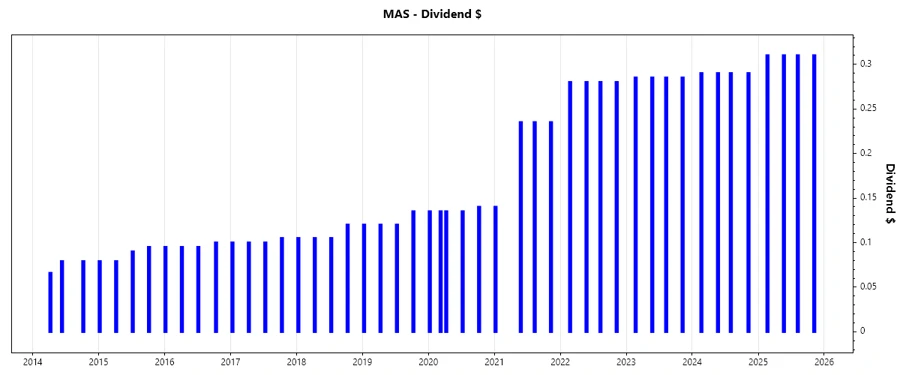
🏆 Dividend History
Masco Corporation boasts a robust dividend history, reflecting its resilience and commitment to shareholder returns over time. The significance of a sustained dividend record cannot be understated, as it often correlates with prudent fiscal management and shareholder-friendly practices.
| Year | Dividend Per Share (USD) |
|---|---|
| 2025 | 1.24 |
| 2024 | 1.16 |
| 2023 | 1.14 |
| 2022 | 1.12 |
| 2021 | 0.85 |
📈 Dividend Growth
Dividend growth is a critical factor as it shows the company's ability to enhance shareholder wealth over time. Masco Corporation has demonstrated a moderate yet steady growth in dividends, reflecting a stable cash flow and a disciplined reinvestment strategy.
| Time | Growth |
|---|---|
| 3 years | 3.45 % |
| 5 years | 12.77 % |
The average dividend growth is 12.77% over 5 years. This shows moderate but steady dividend growth.
💼 Payout Ratio
The payout ratio gauges the portion of earnings distributed as dividends, providing insight into financial discipline and dividend sustainability. A lower ratio suggests potential for dividend increases, while a higher one may imply sustainability risks.
| Key Figure | Ratio |
|---|---|
| EPS-based | 29.59 % |
| Free cash flow-based | 28.57 % |
The EPS payout of 29.59% and FCF payout of 28.57% indicate a conservative payout strategy, supporting dividend reliability and future potential increases.
🔍 Cashflow & Capital Efficiency
Evaluating cash flow and capital efficiency determines the robustness of the company’s financial operations and its ability to cover dividends with operations-generated cash.
| Metric | 2024 | 2023 | 2022 |
|---|---|---|---|
| Free Cash Flow Yield | 5.73 % | 7.76 % | 5.71 % |
| Earnings Yield | 5.20 % | 6.03 % | 7.85 % |
| CAPEX to Operating Cash Flow | 16.30 % | 17.20 % | 26.67 % |
| Stock-based Compensation to Revenue | 0 % | 0.39 % | 0 % |
| Free Cash Flow / Operating Cash Flow Ratio | 84.37 % | 82.83 % | 73.33 % |
Masco Corporation's cash flow metrics reflect a healthy generation of cash relative to operating needs, crucial for sustained dividend payments and reinvestment capabilities.
🔍 Balance Sheet & Leverage Analysis
An analysis of leveraging metrics reveals insights into the company's financial health, particularly its debt management and liquidity position.
| Metric | 2024 | 2023 | 2022 |
|---|---|---|---|
| Debt-to-Equity | -11.48 | -25.80 | -7.18 |
| Debt-to-Assets | 64.07 % | 60.62 % | 66.42 % |
| Debt-to-Capital | 109.54 % | 104.03 % | 116.19 % |
| Net Debt to EBITDA | 1.83 | 1.75 | 2.07 |
| Current Ratio | 1.75 | 1.68 | 1.56 |
| Quick Ratio | 1.15 | 1.08 | 0.91 |
Despite high debt ratios, Masco Corporation maintains adequate liquidity, reflected in its current and quick ratios, indicating its ability to meet short-term obligations.
📊 Fundamental Strength & Profitability
Fundamental ratios give an edge to understanding overall business performance, revealing profitability, efficiency, and the company’s capability to add shareholder value.
| Metric | 2024 | 2023 | 2022 |
|---|---|---|---|
| Return on Equity | -2.94 % | -7.21 % | -1.76 % |
| Return on Assets | 16.39 % | 16.93 % | 16.31 % |
| Net Margin | 10.50 % | 11.40 % | 9.75 % |
| Gross Margin | 36.17 % | 35.60 % | 31.26 % |
Masco Corporation exhibits resilient profitability with strong returns on assets and maintained gross margins, affirming its competitiveness and operational efficiency.
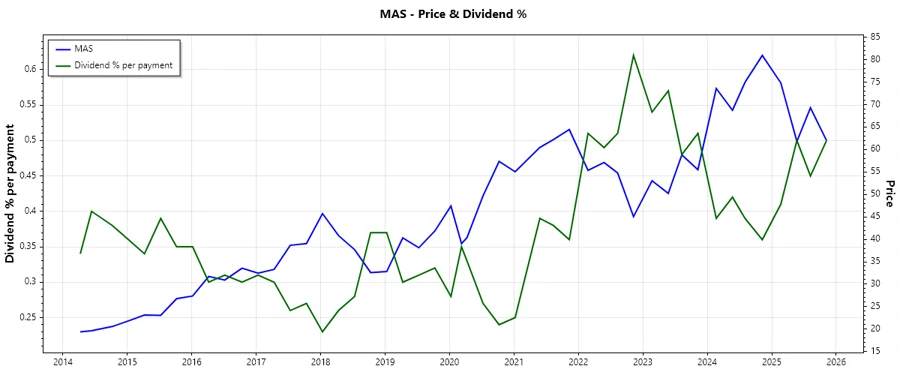
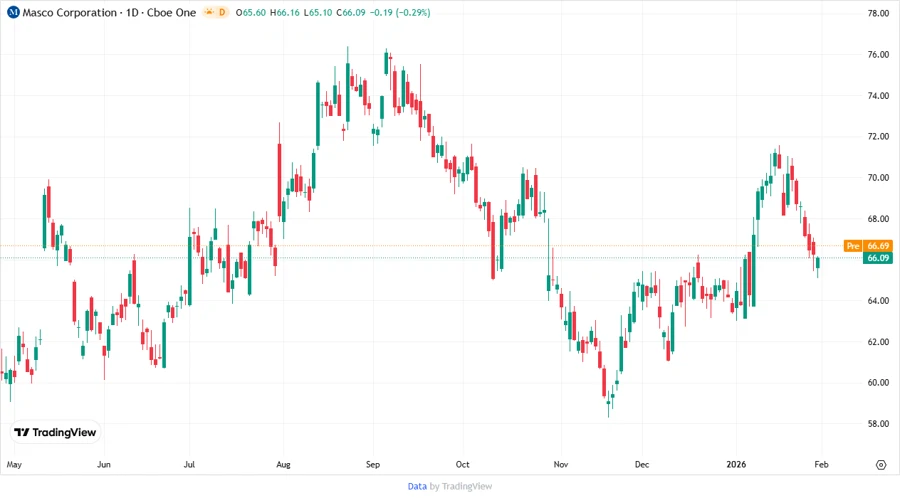
📊 Price Development
🗳️ Dividend Scoring System
This scoring system evaluates Masco Corporation's dividend quality based on multiple financial parameters critical for investors.
| Category | Score | Score Bar |
|---|---|---|
| Dividend yield | 4 | |
| Dividend Stability | 5 | |
| Dividend growth | 3 | |
| Payout ratio | 4 | |
| Financial stability | 3 | |
| Dividend continuity | 5 | |
| Cashflow Coverage | 4 | |
| Balance Sheet Quality | 3 |
Overall Score: 31/40
✅ Rating
Masco Corporation maintains a robust dividend structure, underlining a strong commitment to returning value to its shareholders. While its leverage requires monitoring, the company's consistent dividend payout, historical growth, and reasonable payout ratios make it a viable option for income-focused investors seeking stability with moderate growth expectations.