September 22, 2025 a 02:47 am

MAS: Dividend Analysis - Masco Corporation
Masco Corporation represents a stable investment in the financial market, demonstrating a robust history of consistent dividend payments. With significant coverage in its sector, Masco showcases a balanced approach between reinvestment and shareholder returns.
📊 Overview
| Metric | Value |
|---|---|
| Sector | Unknown |
| Dividend yield | 1.76 % |
| Current dividend per share | 1.17 USD |
| Dividend history | 43 years |
| Last cut or suspension | None |
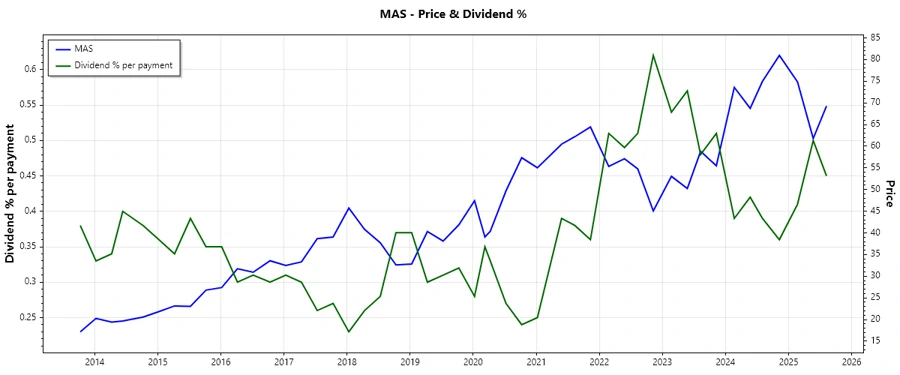
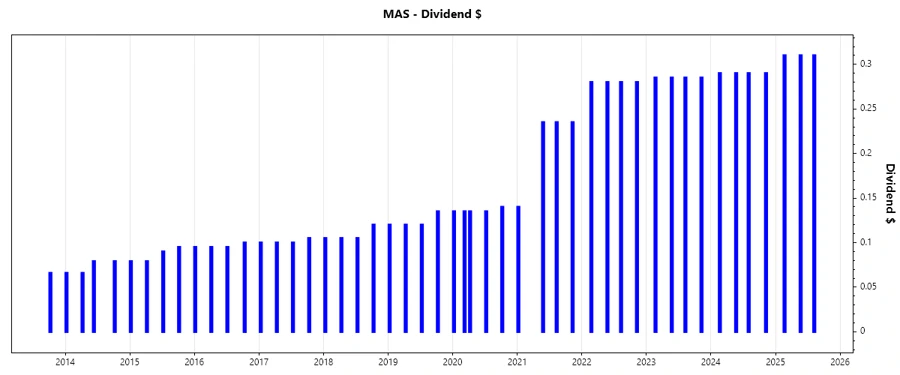
📈 Dividend History
The extensive dividend history of Masco Corporation underscores its commitment to returning capital to shareholders. Maintaining dividends through different market cycles provides investors with a sense of reliability and financial strength.
| Year | Dividend per Share (USD) |
|---|---|
| 2025 | 0.93 |
| 2024 | 1.16 |
| 2023 | 1.14 |
| 2022 | 1.12 |
| 2021 | 0.85 |
📈 Dividend Growth
The growth of dividends is a critical metric for assessing value creation. Masco exhibits a promising growth track of its dividends, which mirrors well-managed financial policies and earnings growth prospects.
| Time | Growth |
|---|---|
| 3 years | 11.14 % |
| 5 years | 18.57 % |
The average dividend growth is 18.57 % over 5 years. This shows moderate but steady dividend growth.
✅ Payout Ratio
The payout ratio is critical in examining the sustainability of dividend payments in relation to company earnings and cash flow. A healthy payout signifies a balanced use of earnings, ensuring both shareholder returns and company growth.
| Key figure | Ratio |
|---|---|
| EPS-based | 30.39 % |
| Free cash flow-based | 19.27 % |
With a 30.39 % EPS payout and 19.27 % FCF payout, Masco demonstrates a prudent payout strategy, suggesting robust earnings retention for prospective growth initiatives.
📊 Cashflow & Capital Efficiency
Cash flow metrics and capital efficiency provide insights into the firm's operational effectiveness and financial management practices, affecting liquidity and growth capabilities.
| Year | 2024 | 2023 | 2022 |
|---|---|---|---|
| Free Cash Flow Yield | 5.73 % | 7.76 % | 5.71 % |
| Earnings Yield | 5.20 % | 6.03 % | 7.82 % |
| CAPEX to Operating Cash Flow | 15.63 % | 17.20 % | 26.67 % |
| Stock-based Compensation to Revenue | 0 % | 0.39 % | 0.56 % |
| Free Cash Flow / Operating Cash Flow Ratio | 84.37 % | 82.80 % | 73.33 % |
These metrics highlight Masco's robust cash flow structure and effective capital utilization, empowering it to support ongoing dividend distributions and strategic initiatives.
📉 Balance Sheet & Leverage Analysis
A meticulous balance sheet review and leverage analysis are crucial in appraising financial robustness and the accessibility of operational liquidity.
| Year | 2024 | 2023 | 2022 |
|---|---|---|---|
| Debt-to-Equity | -11.48 | -25.80 | -7.18 |
| Debt-to-Assets | 64.07 % | 60.62 % | 66.42 % |
| Debt-to-Capital | 109.54 % | 104.03 % | 116.19 % |
| Net Debt to EBITDA | 1.83 | 1.75 | 2.01 |
| Current Ratio | 1.75 | 1.68 | 1.56 |
| Quick Ratio | 1.15 | 1.08 | 0.91 |
| Financial Leverage | -17.91 | -42.56 | -10.81 |
The high negative debt-to-equity ratio signals potential financial restructuring strategies. Nevertheless, manageable debt levels, complemented by adequate liquidity metrics, provide a firm standing in the sector.
✅ Fundamental Strength & Profitability
Analyzing profitability ratios aids in assessing operational efficiency and the ability to sustainably generate revenues and returns.
| Year | 2024 | 2023 | 2022 |
|---|---|---|---|
| Return on Equity | -2.94 % | -7.21 % | -1.76 % |
| Return on Assets | 16.39 % | 16.93 % | 16.27 % |
| Margins: Net | 10.50 % | 11.40 % | 9.72 % |
| EBIT | 16.10 % | 16.87 % | 15.50 % |
| EBITDA | 18.01 % | 18.74 % | 17.17 % |
| Gross | 36.16 % | 35.60 % | 31.26 % |
Despite negative equity, Masco's profitability metrics remain solid, demonstrating a capacity to generate substantial operating cash flows supporting business growth and dividend sustainability.
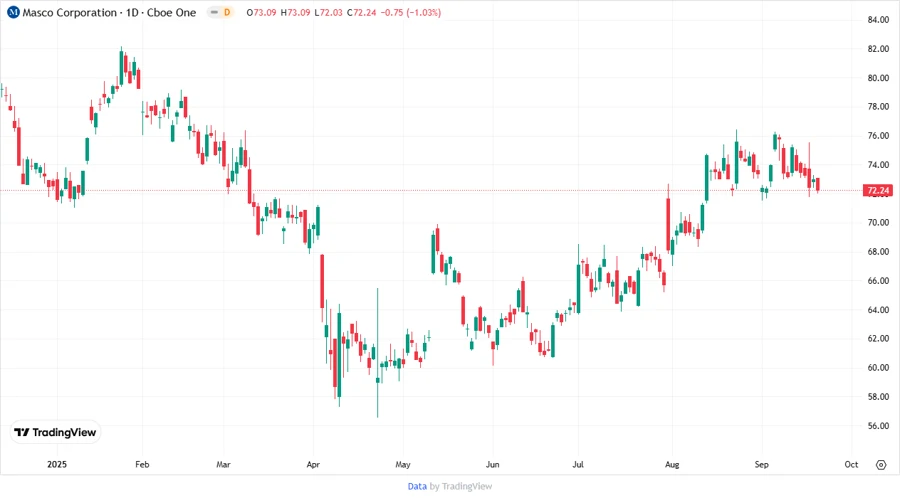
📈 Price Development
🗣️ Dividend Scoring System
| Criteria | Score | Graphical Representation |
|---|---|---|
| Dividend yield | 3 | |
| Dividend Stability | 5 | |
| Dividend growth | 4 | |
| Payout ratio | 5 | |
| Financial stability | 3 | |
| Dividend continuity | 5 | |
| Cashflow Coverage | 4 | |
| Balance Sheet Quality | 3 |
Total Score: 32/40
🗣️ Rating
Masco Corporation demonstrates a capable dividend profile marked by consistent distribution history and prudent financial management. While certain leverage metrics exhibit room for improvement, the company's overall robustness alongside growth potential positions it strongly within its sector, making it a viable candidate for dividend-focused portfolios.
Smart Data Insight
Master the Perfect Entry & Exit for this Stock
Don't leave your profits to chance. Historically, this stock follows specific seasonal patterns that institutional traders use to maximize returns.
- ✅ Identify the "Golden Buying Window"
- ✅ Avoid high-risk correction cycles
- ✅ Backtested data from the last 20+ years