July 20, 2025 a 11:31 am

MAS: Dividend Analysis - Masco Corporation
Masco Corporation (MAS) presents a commendable dividend profile marked by a stable and long-standing history of payouts. The company's consistent dividend growth over the years is a testament to its financial robustness and shareholder commitment. Despite some negative figures in profitability measures like ROE, the firm maintains a healthy payout ratio, which ensures sustainable dividend distributions.
📊 Overview
Masco Corporation operates within the Consumer Goods sector, proffering a dividend yield of 2.41%. With a current dividend per share of 1.17 USD, the company boasts an impressive dividend history, unblemished by recent cuts or suspensions over 43 years, signaling exceptional dividend resilience.
| Metric | Value |
|---|---|
| Sector | Consumer Goods |
| Dividend yield | 2.41% |
| Current dividend per share | 1.17 USD |
| Dividend history | 43 years |
| Last cut or suspension | None |
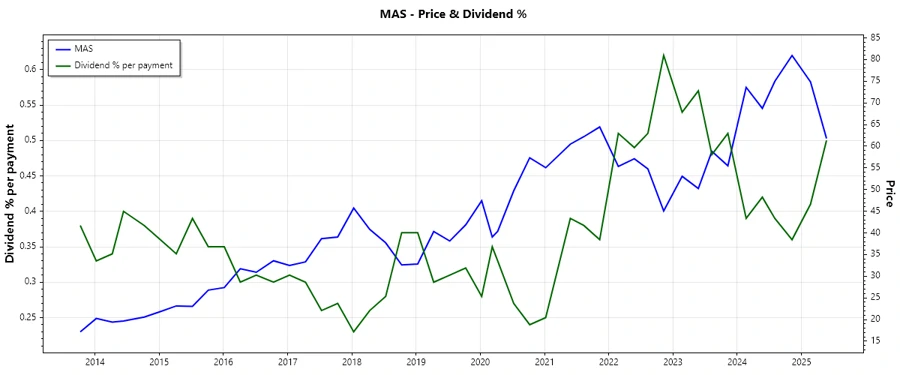
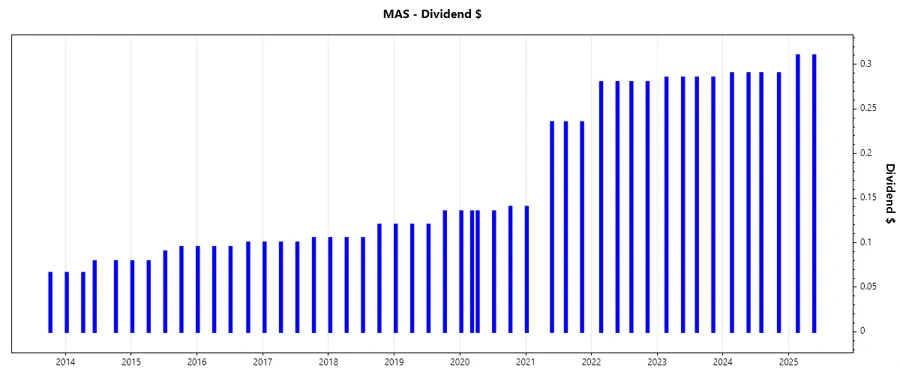
🗣️ Dividend History
The extended dividend history of Masco is a hallmark of stability and reliability. A dependable dividend history is crucial as it reassures investors about the company's ability to generate consistent returns.
| Year | Dividend per Share (USD) |
|---|---|
| 2025 | 0.62 |
| 2024 | 1.16 |
| 2023 | 1.14 |
| 2022 | 1.12 |
| 2021 | 0.845 |
📈 Dividend Growth
Dividend growth is a critical indicator of a company's long-term financial health. Masco's 3-year growth rate is 11.14%, while the 5-year growth stands at 18.57%. Consistent growth suggests a firm commitment to increasing shareholder value.
| Time | Growth |
|---|---|
| 3 years | 11.14% |
| 5 years | 18.57% |
The average dividend growth is 18.57% over 5 years. This shows moderate but steady dividend growth.
⚖️ Payout Ratio
Evaluating payout ratios helps assess dividend sustainability. An EPS-based ratio of 31.15% and a free cash flow-based ratio of 29.19% indicate that Masco comfortably covers its dividends without jeopardizing financial health.
| Key figure | Ratio |
|---|---|
| EPS-based | 31.15% |
| Free cash flow-based | 29.19% |
💵 Cashflow & Capital Efficiency
Assessing cash flow and capital efficiency provides insight into a company's ability to reinvest in growth and meet its obligations. Masco maintains substantial free cash flow yields, indicative of efficient cash use.
| Metric | 2024 | 2023 | 2022 |
|---|---|---|---|
| Free Cash Flow Yield | 5.73% | 7.76% | 5.71% |
| Earnings Yield | 5.20% | 6.03% | 7.83% |
| CAPEX to Operating Cash Flow | 15.63% | 17.20% | 26.67% |
| Stock-based Compensation to Revenue | 0.00% | 0.39% | 0.56% |
| Free Cash Flow / Operating Cash Flow Ratio | 84.37% | 82.80% | 73.33% |
| ROIC | 29.30% | 28.47% | 27.78% |
💪 Balance Sheet & Leverage Analysis
A strong balance sheet ensures that a company can weather financial storms and support dividend payments. Masco's leverage ratios and coverage figures indicate a cautious approach in its financial structuring.
| Metric | 2024 | 2023 | 2022 |
|---|---|---|---|
| Debt-to-Equity | -11.48 | -25.44 | -13.00 |
| Debt-to-Assets | 64.07% | 59.78% | 65.66% |
| Debt-to-Capital | 109.54% | 104.09% | 108.33% |
| Net Debt to EBITDA | 1.83 | 1.72 | 1.98 |
| Current Ratio | 1.75 | 1.68 | 1.56 |
| Quick Ratio | 1.15 | 1.08 | 0.91 |
| Financial Leverage | -17.91 | -42.56 | -19.80 |
📃 Fundamental Strength & Profitability
High margins and return metrics reflect operational efficiency and profitability. While some profitability metrics have experienced volatility, Masco remains fundamentally robust.
| Metric | 2024 | 2023 | 2022 |
|---|---|---|---|
| Return on Equity | -2.94 | -7.21 | -3.22 |
| Return on Assets | 16.39% | 16.93% | 16.27% |
| Net Profit Margin | 10.50% | 11.40% | 9.72% |
| EBIT Margin | 16.10% | 16.87% | 15.50% |
| EBITDA Margin | 18.05% | 18.74% | 17.17% |
| Gross Margin | 36.17% | 35.60% | 31.26% |
| R&D to Revenue | 0.00% | 0.00% | 0.00% |
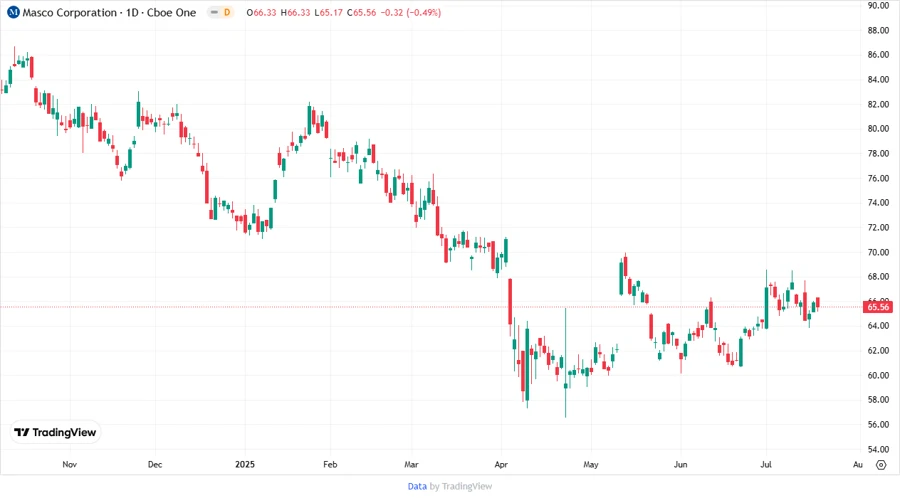
💹 Price Development
✅ Dividend Scoring System
| Criterion | Score | |
|---|---|---|
| Dividend yield | 3 | |
| Dividend Stability | 5 | |
| Dividend growth | 4 | |
| Payout ratio | 4 | |
| Financial stability | 4 | |
| Dividend continuity | 5 | |
| Cashflow Coverage | 4 | |
| Balance Sheet Quality | 3 |
Total Score: 32/40
🛑 Rating
Masco Corporation exhibits a solid dividend track record with moderate growth potential. The sustainable payout ratio and financial stability position it as a reliable dividend-paying investment. Nonetheless, attention should be paid to profitability metrics which have shown variability. Overall, Masco is well-suited for investors seeking steady income and reasonable growth.