July 03, 2025 a 07:46 am


MAS: Dividend Analysis - Masco Corporation
Masco Corporation has a long-standing tradition of consistent dividend payments, reflecting its commitment to returning value to shareholders. The company offers a respectable dividend yield supported by a history of 43 years of unbroken distributions. It exemplifies a robust payout strategy with relatively moderate payout ratios, indicating room for future growth.
📊 Overview
With a considerable industry presence, Masco Corporation operates in the sector that provides it with a stable foundation for sustainable dividend practices.
| Sector | Dividend Yield | Current Dividend Per Share (USD) | Dividend History (Years) | Last Cut or Suspension |
|---|---|---|---|---|
| N/A | 1.94% | 1.17 USD | 43 years | None |
📈 Dividend History
The dividend history of Masco Corporation underpins its reliability as an income-generating investment. Consistent payments over 43 years demonstrate financial stability and commitment to shareholder returns.
| Year | Dividend Per Share (USD) |
|---|---|
| 2025 | 0.62 |
| 2024 | 1.16 |
| 2023 | 1.14 |
| 2022 | 1.12 |
| 2021 | 0.85 |
📈 Dividend Growth
The growth of dividends is a critical indicator of how a company might perform in the future. Masco Corporation's moderate growth rates suggest a future potential in enhancing investor returns.
| Time | Growth |
|---|---|
| 3 years | 11.14% |
| 5 years | 18.57% |
The average dividend growth is 18.57% over 5 years. This shows moderate but steady dividend growth.
🗣️ Payout Ratio
The payout ratio provides insights into how much of the company's earnings and cash flow are returned to shareholders. Masco's EPS and FCF payout ratios are well-managed, indicating a balance between rewarding investors and retaining earnings for growth.
| Key Figure | Ratio |
|---|---|
| EPS-based | 31.15% |
| Free cash flow-based | 29.19% |
A payout ratio of 31.15% based on EPS and 29.19% based on FCF suggests that Masco maintains a healthy balance between distributing income to shareholders and reinvesting into the company.
📈 Cashflow & Capital Efficiency
The evaluation of cashflows and capital efficiency is crucial to understanding Masco's capability to sustain dividends and fund its operations.
| Year | Free Cash Flow Yield | Earnings Yield | CAPEX to Operating Cash Flow | Stock-based Compensation to Revenue | Free Cash Flow / Operating Cash Flow Ratio |
|---|---|---|---|---|---|
| 2024 | 5.73% | 5.20% | 15.63% | 0% | 84.37% |
| 2023 | 7.76% | 6.03% | 17.20% | 0.39% | 82.80% |
| 2022 | 5.71% | 7.83% | 26.67% | 0.56% | 73.33% |
The data indicates a strong cashflow efficiency that ensures ample coverage for dividend payments and operational investments.
📉 Balance Sheet & Leverage Analysis
Analyzing the financial leverage and balance sheet composition helps gauge Masco's financial stability and liquidity, impacting its ability to sustain dividends in turbulent markets.
| Year | Debt-to-Equity | Debt-to-Assets | Debt-to-Capital | Net Debt to EBITDA | Current Ratio | Quick Ratio |
|---|---|---|---|---|---|---|
| 2024 | -11.48 | 64.07% | 109.54% | 1.83 | N/A | 1.15 |
| 2023 | -25.44 | 59.78% | 104.09% | 1.72 | N/A | 1.08 |
| 2022 | -13.00 | 65.66% | 108.33% | 1.98 | N/A | 0.90 |
The stable current and quick ratios, albeit with high leverage, suggest a well-managed debt portfolio capable of supporting operational stability.
📊 Fundamental Strength & Profitability
Key fundamental metrics reveal Masco's profitability and operational efficiency, imperative for sustaining long-term dividends.
| Year | Return on Equity | Return on Assets | ROIC | Gross Margin | EBIT Margin | EBITDA Margin | Net Profit Margin | R&D to Revenue |
|---|---|---|---|---|---|---|---|---|
| 2024 | -2.94% | 16.39% | 29.30% | 36.17% | 16.10% | 18.01% | 10.50% | 0% |
| 2023 | -7.21% | 16.93% | 28.47% | 35.60% | 16.87% | 18.74% | 11.40% | 0% |
| 2022 | -3.22% | 16.27% | 27.78% | 31.26% | 15.50% | 17.17% | 9.72% | 0% |
Despite negative return on equity, other profitability metrics such as ROIC and net profit margin remain solid, indicating core operational strength.
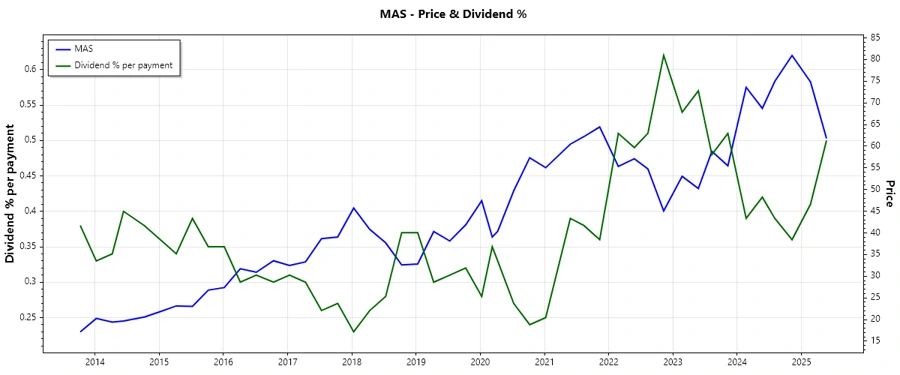
Price Development
🏆 Dividend Scoring System
Below is an individual scoring system to assess Masco Corporation's dividend reliability and attractiveness:
| Criteria | Score | Rank |
|---|---|---|
| Dividend Yield | 4 | |
| Dividend Stability | 5 | |
| Dividend Growth | 3 | |
| Payout Ratio | 4 | |
| Financial Stability | 3 | |
| Dividend Continuity | 5 | |
| Cashflow Coverage | 4 | |
| Balance Sheet Quality | 3 |
Total Score: 31/40
✅ Rating
Masco Corporation presents a solid dividend profile, with a consistent history and a dedicated approach to shareholder returns. The company’s financial stability, despite certain leverage concerns, along with a commitment to dividend continuity, offers investors a reliable income stream. Masco is a worthwhile consideration for dividend investors seeking a moderate growth potential with stable returns.