June 02, 2025 a 03:31 am


MAS: Dividend Analysis - Masco Corporation
Masco Corporation demonstrates a robust dividend profile with a steady history of payments spanning over four decades. This company's financial health is marked by a steady EPS-based payout ratio and a solid dividend yield, which enhances its appeal as a dependable dividend-paying stock.
📊 Overview
Masco Corporation operates within the industrial sector, offering a stable dividend yield of 1.94%. The current dividend per share stands at USD 1.17, showcasing a consistent growth pattern over 43 consecutive years. The company has not experienced a dividend cut or suspension recently, underscoring its commitment to returning value to shareholders.
| Metric | Value |
|---|---|
| Sector | Industrial |
| Dividend Yield | 1.94% |
| Current Dividend per Share | USD 1.17 |
| Dividend History | 43 years |
| Last Cut or Suspension | None |
📉 Dividend History
Masco Corporation boasts an impressive dividend history with steady increases each year, a crucial indicator of financial health and investor appeal. A reliable dividend payment schedule often signifies robust cash flow and management's commitment to shareholder returns.
| Year | Dividend per Share (USD) |
|---|---|
| 2025 | 0.62 |
| 2024 | 1.16 |
| 2023 | 1.14 |
| 2022 | 1.12 |
| 2021 | 0.85 |
📈 Dividend Growth
Evaluating Masco's dividend growth portrays a positive outlook with a 5-year growth rate of 18.57%. This reflects the company's capability to enhance shareholder returns through consistent dividend increases, a strong indicator of a long-term success strategy.
| Time | Growth |
|---|---|
| 3 years | 11.14% |
| 5 years | 18.57% |
The average dividend growth is 18.57% over 5 years. This shows moderate but steady dividend growth.
🗣️ Payout Ratio
Payout ratios are pivotal in assessing the sustainability of dividend payments. With an EPS-based payout ratio of 31.15% and a free cash flow payout ratio of 29.19%, Masco retains a substantial portion of its earnings, indicating a cautious approach towards maintaining dividend stability.
| Key Figure | Ratio |
|---|---|
| EPS-based | 31.15% |
| Free cash flow-based | 29.19% |
These ratios reflect a healthy balance in Masco's financial strategy, ensuring ample capital for reinvestment and growth.
📊 Cashflow & Capital Efficiency
The analysis of cashflow and capital efficiency reveals critical insights into the operational efficiency and financial health of Masco Corporation. Consistent earnings and free cash flow yields highlight strong cash generation capabilities, while the CAPEX to Operating Cash Flow Ratio indicates efficient capital expenditure management.
| Metric | 2024 | 2023 | 2022 |
|---|---|---|---|
| Free Cash Flow Yield | 5.73% | 7.76% | 5.71% |
| Earnings Yield | 5.20% | 6.03% | 7.83% |
| CAPEX to Operating Cash Flow | 15.63% | 17.20% | 26.67% |
| Stock-based Compensation to Revenue | 0% | 0.39% | 0.56% |
| Free Cash Flow / Operating Cash Flow Ratio | 84.37% | 82.80% | 73.33% |
These metrics suggest robust cash flow stability and effective capital deployment, which are crucial for sustainable growth and investor confidence.
⚠️ Balance Sheet & Leverage Analysis
A thorough evaluation of Masco's balance sheet and leverage ratios reflects financial stability. Despite high leverage ratios, the company's ability to cover interest obligations is strong, signifying adequate liquidity and prudent debt management.
| Metric | 2024 | 2023 | 2022 |
|---|---|---|---|
| Debt-to-Equity | -11.48 | -25.44 | -13.00 |
| Debt-to-Assets | 64.07% | 59.78% | 65.66% |
| Debt-to-Capital | 109.54% | 104.09% | 108.33% |
| Net Debt to EBITDA | 1.83 | 1.72 | 1.98 |
| Current Ratio | 1.75 | 0 | 1.56 |
| Quick Ratio | 1.15 | 1.08 | 0.91 |
| Financial Leverage | -17.91 | -42.56 | -19.80 |
While leverage is substantially high, the ability to maintain liquidity and service debt reflects a resilient financial framework.
✅ Fundamental Strength & Profitability
Masco Corporation showcases resilience with strong profitability metrics, demonstrated by a healthy EBIT margin and return on invested capital. High margins suggest robust operational efficiency, pivotal for sustaining competitive advantage.
| Metric | 2024 | 2023 | 2022 |
|---|---|---|---|
| Return on Equity | -2.94% | -7.21% | -3.22% |
| Return on Assets | 16.39% | 16.93% | 16.27% |
| Net Margin | 10.50% | 11.40% | 9.72% |
| EBIT Margin | 16.10% | 16.87% | 15.50% |
| EBITDA Margin | 18.01% | 18.74% | 17.17% |
| Gross Margin | 36.17% | 35.60% | 31.26% |
| R&D to Revenue | 0% | 0% | 0% |
Resilient margins and returns underscore the strategic competence in capitalizing on operational efficiencies and market positioning.
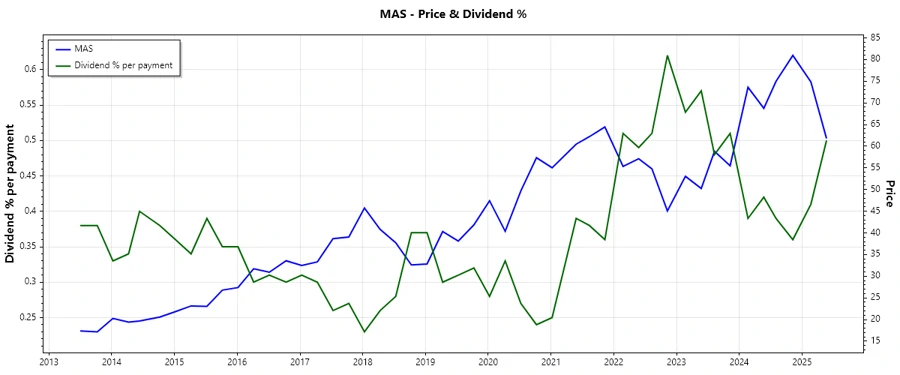
📈 Price Development
🏆 Dividend Scoring System
Masco Corporation is evaluated based on key dividend metrics to ascertain overall performance strength using a scale of 1 to 5 for each category.
| Criterion | Score | Bar |
|---|---|---|
| Dividend Yield | 3.5 | |
| Dividend Stability | 5 | |
| Dividend Growth | 4.5 | |
| Payout Ratio | 4 | |
| Financial Stability | 3 | |
| Dividend Continuity | 5 | |
| Cashflow Coverage | 4 | |
| Balance Sheet Quality | 3.5 |
Total Score: 32/40
⭐ Rating & Recommendation
Masco Corporation presents a solid investment opportunity with a strong dividend history, sustainable payout ratios, and reasonable growth prospects. While leverage remains a concern, the company's effectiveness in maintaining liquidity and addressing debt obligations reaffirms its potential as a sound investment choice for dividend-focused investors.
Smart Data Insight
Master the Perfect Entry & Exit for this Stock
Don't leave your profits to chance. Historically, this stock follows specific seasonal patterns that institutional traders use to maximize returns.
- ✅ Identify the "Golden Buying Window"
- ✅ Avoid high-risk correction cycles
- ✅ Backtested data from the last 20+ years