April 25, 2026 a 07:46 am

MAR: Dividend Analysis - Marriott International, Inc.
Marriott International, Inc. is a leading hospitality company with a robust dividend history spanning 28 years. While its current dividend yield of 0.76% might appear modest, the company's consistent dividend growth signals stability and long-term commitment to returning value to shareholders. Additionally, with no recent dividend cuts or suspensions, Marriott presents a reliable choice for dividend-oriented investors.
📊 Overview
The dividend profile of Marriott International reveals its solid standing within the hospitality sector. With a steady history and consistent growth, the company offers a dependable yet modest dividend yield, indicating long-term reliability but requiring consideration of growth potential in the context of total returns.
| Detail | Value |
|---|---|
| Sector | Hospitality |
| Dividend yield | 0.76% |
| Current dividend per share | $2.67 USD |
| Dividend history | 28 years |
| Last cut or suspension | None |
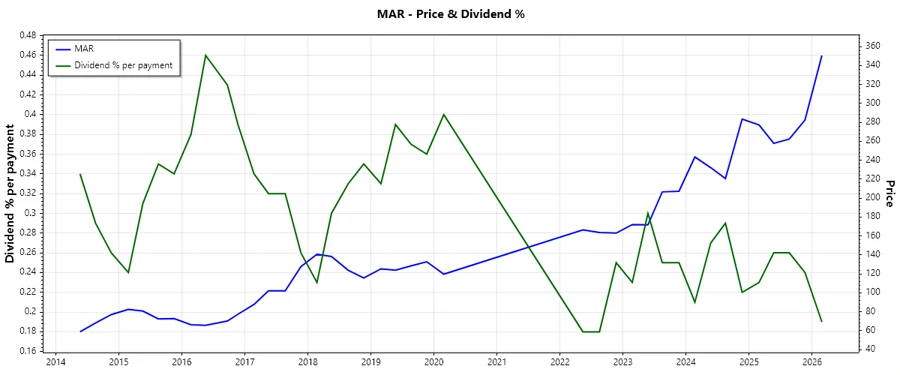
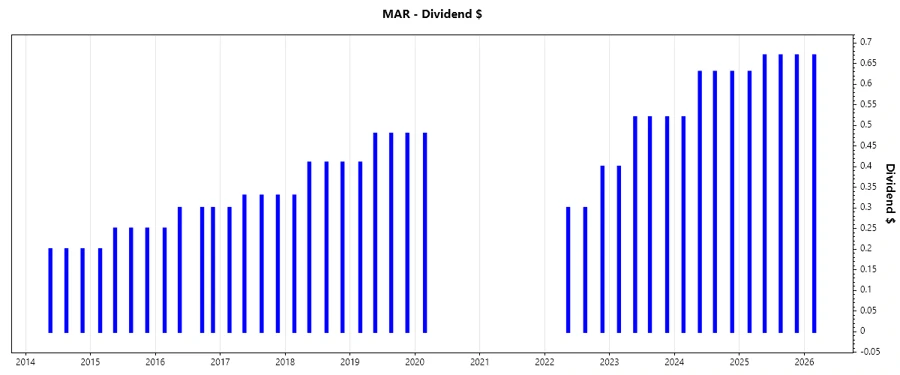
🗣️ Dividend History
Marriott International boasts a resilient dividend payment history. Over the years, the company has consistently increased dividend payouts, reflecting its commitment to returning value to shareholders. This stability is crucial for investors seeking dependable income streams.
| Year | Dividend per share (USD) |
|---|---|
| 2026 | 0.67 |
| 2025 | 2.64 |
| 2024 | 2.41 |
| 2023 | 1.96 |
| 2022 | 1.00 |
📈 Dividend Growth
Dividend growth is a central metric for investors focused on long-term value creation. Marriott's dividend has grown by 38.2% over the last 3 years and by 40.63% over the last 5 years, suggesting a balanced and steady increase. This consistent growth indicates Marriott's robust financial health and strategic foresight.
| Time | Growth |
|---|---|
| 3 years | 38.2% |
| 5 years | 40.63% |
The average dividend growth is 40.63% over 5 years. This shows moderate but steady dividend growth.
✅ Payout Ratio
The payout ratio is a vital indicator of a company's ability to maintain dividend distributions. Marriott International maintains healthy ratios with an EPS-based payout of 27.60% and a free cash flow-based payout of 24.45%. This balance suggests Marriott is maintaining its dividends comfortably within earnings, indicating prudent financial management.
| Key figure | Ratio |
|---|---|
| EPS-based | 27.60% |
| Free cash flow-based | 24.45% |
📈 Cashflow & Capital Efficiency
Analyzing cashflow and capital efficiency is essential to understanding Marriott's operational health and its ability to support dividends. With a free cash flow yield of approximately 2.98% and an earnings yield of 2.63%, Marriott shows capabilities to generate substantial cash, supporting efficient capital allocation and dividend payments.
| Year | 2025 | 2024 | 2023 |
|---|---|---|---|
| Free Cash Flow Yield | 3.13% | 2.52% | 3.99% |
| Earnings Yield | 3.12% | 2.99% | 4.53% |
| CAPEX to Operating Cash Flow | 18.80% | 27.28% | 14.26% |
| Stock-based Compensation to Revenue | 0.90% | 0.94% | 0.86% |
| Free Cash Flow / Operating Cash Flow Ratio | 81.20% | 72.72% | 85.74% |
📉 Balance Sheet & Leverage Analysis
A deep dive into the balance sheet highlights Marriott's leverage strategy and financial stability. Despite a challenging debt-to-equity ratio, the relatively stable debt-to-assets suggest Marriott's manageable leverage, backed by a competent liquidity profile.
| Year | 2025 | 2024 | 2023 |
|---|---|---|---|
| Debt-to-Equity | -4.53 | -5.09 | -18.71 |
| Debt-to-Assets | 62.03% | 58.21% | 49.70% |
| Debt-to-Capital | 128.33% | 124.43% | 105.65% |
| Net Debt to EBITDA | 3.62 | 3.42 | 2.84 |
| Current Ratio | 0.43 | 0.40 | 0.43 |
| Quick Ratio | 0.43 | 0.40 | 0.43 |
| Financial Leverage | -7.30 | -8.75 | -37.65 |
📈 Fundamental Strength & Profitability
Marriott's fundamental strengths underscore its profitability metrics, vital for assessing potential investment returns. Despite a negative return on equity, other profitability margins depict its operational efficiency and resilience.
| Year | 2025 | 2024 | 2023 |
|---|---|---|---|
| Return on Equity | -0.69 | -0.79 | -4.52 |
| Return on Assets | 0.09 | 0.09 | 0.12 |
| Margins: Net, EBIT, EBITDA, Gross | 9.93%, 16.00%, 17.14%, 21.34% | 9.46%, 15.32%, 17.28%, 20.32% | 13.00%, 16.63%, 18.47%, 21.61% |
| Research & Development to Revenue | 0% | 0% | 0% |
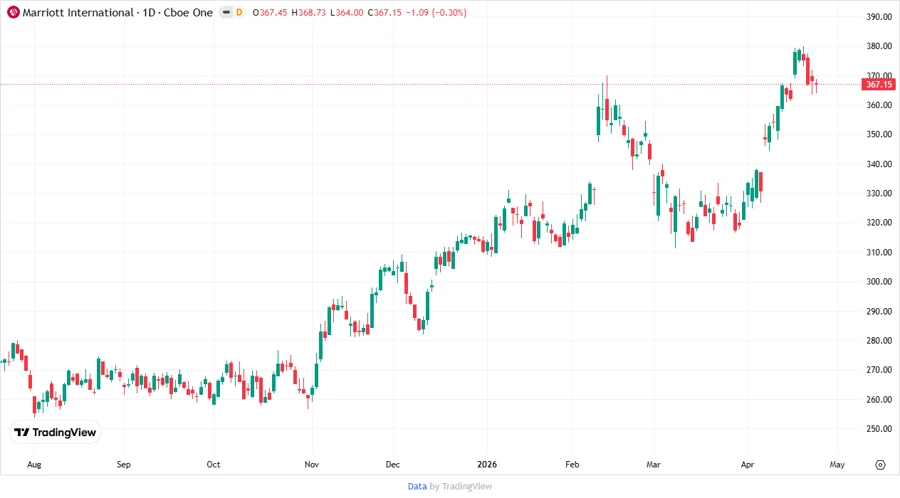
📉 Price Development
📊 Dividend Scoring System
| Category | Score | Scale |
|---|---|---|
| Dividend yield | 3 | |
| Dividend stability | 5 | |
| Dividend growth | 4 | |
| Payout ratio | 4 | |
| Financial stability | 3 | |
| Dividend continuity | 5 | |
| Cashflow Coverage | 3 | |
| Balance Sheet Quality | 3 |
Overall Score: 30/40
🗣️ Rating
Marriott International's dividend profile is indicative of a stable and reliable investment for those prioritizing dividend income. While the yield is modest, the consistent growth and absence of recent cuts reinforce its strength as a preferred option for long-term dividend investors.
Smart Data Insight
Master the Perfect Entry & Exit for this Stock
Don't leave your profits to chance. Historically, this stock follows specific seasonal patterns that institutional traders use to maximize returns.
- ✅ Identify the "Golden Buying Window"
- ✅ Avoid high-risk correction cycles
- ✅ Backtested data from the last 20+ years