October 30, 2025 a 07:46 am


MAR: Dividend Analysis - Marriott International, Inc.
Marriott International, Inc. showcases a resilient dividend history, bolstered by its impressive market cap of $71 billion. With a moderate dividend yield near 1% and a 27-year track record, it offers a blend of stability and modest growth potential. Given the substantial capital returns and steady payout ratios, investors are presented with consistent income potential alongside capital appreciation.
📊 Overview
Marriott International operates primarily in the Hospitality sector, offering a dividend yield of 0.99%. The current dividend per share stands at $2.40, with a 27-year history of payments and no recent cuts or suspensions.
| Key Figures | Details |
|---|---|
| Sector | Hospitality |
| Dividend Yield | 0.99% |
| Current Dividend Per Share | $2.40 |
| Dividend History | 27 years |
| Last Cut or Suspension | None |
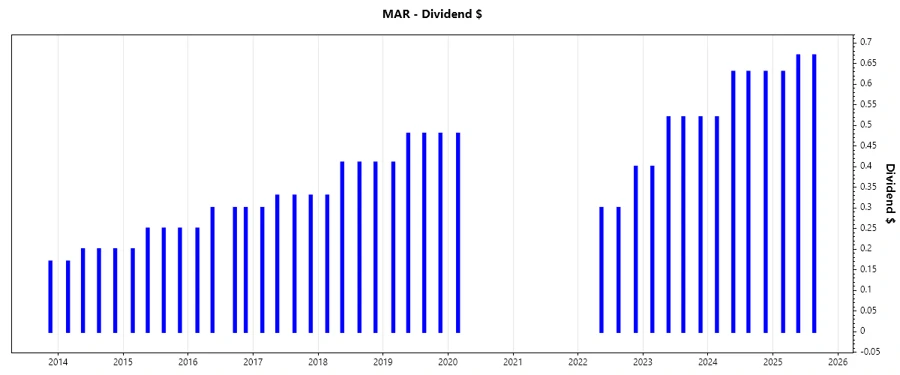
📈 Dividend History
The dividend history underscores Marriott’s commitment to rewarding shareholders consistently over 27 years. This history indicates reliability and investor confidence.
| Year | Dividend Per Share (USD) |
|---|---|
| 2025 | $1.97 |
| 2024 | $2.41 |
| 2023 | $1.96 |
| 2022 | $1.00 |
| 2020 | $0.48 |
📉 Dividend Growth
Analyzing the dividend growth is critical as an indicator of potential future returns. Over 3 and 5 years, Marriott has shown dividend growth of approximately 0.71% and 5.43%, respectively, portraying a stable upward trajectory.
| Time | Growth |
|---|---|
| 3 years | 0.71% |
| 5 years | 5.43% |
The average dividend growth is 5.43% over 5 years. This shows moderate but steady dividend growth.
✅ Payout Ratio
Assessing payout ratios helps determine sustainability. The EPS-based payout ratio is 26.70%, while the free cash flow-based payout ratio is 33.03%. These figures suggest a well-managed approach to distributing profits, balancing reinvestment and shareholder wealth.
| Key figure | Ratio |
|---|---|
| EPS-based | 26.70% |
| Free cash flow-based | 33.03% |
The lower EPS and FCF-based payout ratios suggest prudent financial management, lowering risks associated with excessive distribution commitments.
💰 Cashflow & Capital Efficiency
Marriott’s efficiency in cash flow and capital allocation is pivotal for long-term value creation. Reviewing these metrics across years, the data reflects a disciplined approach to investment and operational cost management.
| Metric | 2022 | 2023 | 2024 |
|---|---|---|---|
| Free Cash Flow Yield | 4.20% | 4.00% | 2.52% |
| Earnings Yield | 4.88% | 4.53% | 3.00% |
| CAPEX to Operating Cash Flow | 14.05% | 14.26% | 27.28% |
| Stock-based Compensation to Revenue | 0.92% | 0.86% | 0.94% |
| Free Cash Flow / Operating Cash Flow Ratio | 85.95% | 85.74% | 72.72% |
The cash flow data underlines stability in operational efficiency and capital utilization, ensuring room for future growth endeavors.
🗣️ Balance Sheet & Leverage Analysis
Marriott’s balance sheet depicts its leverage and liquidity position. By examining key ratios, stakeholders can better appraise its financial robustness.
| Metric | 2022 | 2023 | 2024 |
|---|---|---|---|
| Debt-to-Equity | 19.54 | -18.71 | -5.09 |
| Debt-to-Assets | 44.72% | 49.70% | 58.21% |
| Debt-to-Capital | 95.13% | 105.65% | 124.43% |
| Net Debt to EBITDA | 2.70 | 2.84 | 3.42 |
| Current Ratio | 0.45 | 0.43 | 0.40 |
| Quick Ratio | 0.45 | 0.43 | 0.40 |
| Financial Leverage | 43.69 | -37.65 | -8.75 |
Marriott’s debt positions reflect elevated leverage, demanding scrutiny on debt management strategies, albeit current ratios suggest managing short-term liabilities effectively.
📈 Fundamental Strength & Profitability
Understanding profitability and underlying fundamentals is crucial in evaluating Marriott's potential for delivering long-term stakeholder value.
| Metric | 2022 | 2023 | 2024 |
|---|---|---|---|
| Return on Equity | 4.15% | -4.52% | -0.79% |
| Return on Assets | 0.10% | 0.12% | 0.09% |
| Margins: Net | 11.35% | 13.00% | 9.46% |
| Margins: EBIT | 16.93% | 16.63% | 15.32% |
| Margins: EBITDA | 18.86% | 18.47% | 17.28% |
| Gross Margin | 21.94% | 21.61% | 20.32% |
| Research & Development to Revenue | 0% | 0% | 0% |
While profitability shows some areas of decline, maintaining competitive margins emphasizes Marriott's operational strength amidst industry pressures.
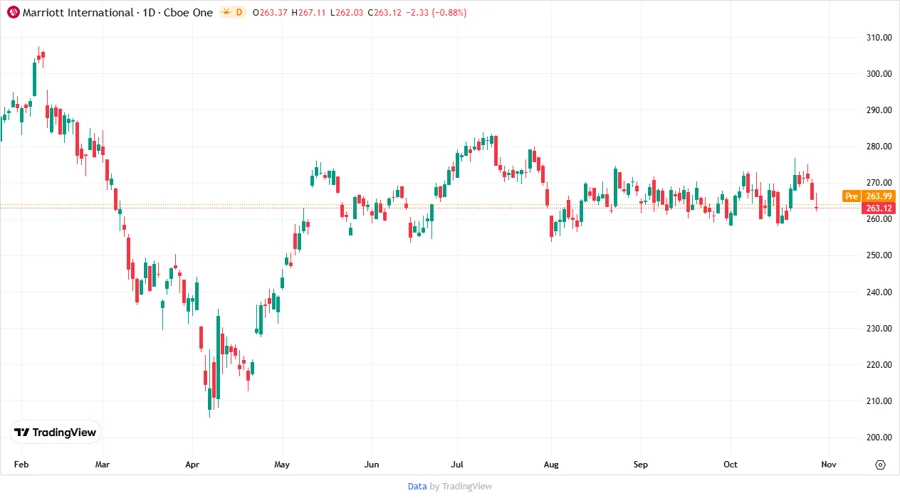
📊 Price Development
✅ Dividend Scoring System
| Category | Score | Score Bar |
|---|---|---|
| Dividend Yield | 2 | |
| Dividend Stability | 4 | |
| Dividend Growth | 3 | |
| Payout Ratio | 4 | |
| Financial Stability | 3 | |
| Dividend Continuity | 5 | |
| Cashflow Coverage | 4 | |
| Balance Sheet Quality | 2 |
Total Score: 27/40
🔎 Rating
Despite modest dividend yields, Marriott International, Inc.'s long-standing history, stable payout policy, and significant growth underscore its prominence as a reliable income-generating investment. However, heightened leverage and fluctuating returns necessitate cautious investment considerations, balancing short-term risks against long-term potential rewards.
Smart Data Insight
Master the Perfect Entry & Exit for this Stock
Don't leave your profits to chance. Historically, this stock follows specific seasonal patterns that institutional traders use to maximize returns.
- ✅ Identify the "Golden Buying Window"
- ✅ Avoid high-risk correction cycles
- ✅ Backtested data from the last 20+ years