August 10, 2025 a 12:47 pm

📊 MAR: Dividend Analysis - Marriott International, Inc.
Marriott International, Inc., a leader in the hospitality industry, has been consistently rewarding its shareholders with dividends for 27 years. Despite economic challenges and market volatility, the company's strategic financial management has ensured a stable dividend yield. With a history of moderate dividend growth and a strong financial backbone, Marriott remains an attractive option for income-focused investors. However, attention to its payout ratios and leverage is advised for long-term dividend sustainability.
📈 Overview
The hospitality giant, Marriott International, Inc., operates within the Consumer Discretionary sector, providing a dividend yield of 1.00%. The current dividend per share is $2.40, with a noteworthy 27-year history of dividend payments. The absence of recent cuts or suspensions highlights Marriott's commitment to maintaining dividend continuity.
| Metric | Value |
|---|---|
| Sector | Consumer Discretionary |
| Dividend Yield | 1.00% |
| Current Dividend per Share | $2.40 |
| Dividend History | 27 years |
| Last Cut or Suspension | None |
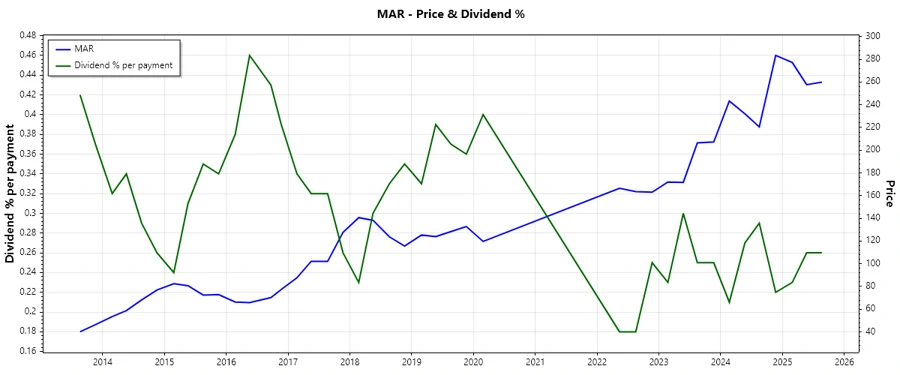
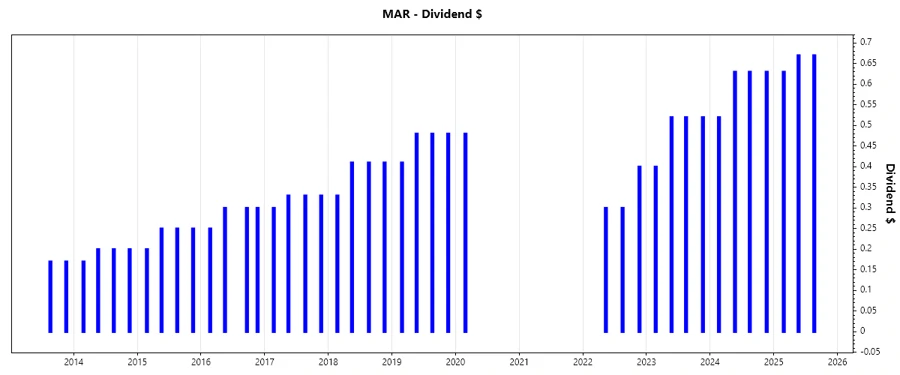
📈 Dividend History
Marriott's dividend history demonstrates resilience, maintaining payments for over two decades, which is pivotal in assessing the reliability of future dividend streams. This track record is essential for investors prioritizing income stability.
| Year | Dividend per Share (USD) |
|---|---|
| 2025 | 1.97 |
| 2024 | 2.41 |
| 2023 | 1.96 |
| 2022 | 1.00 |
| 2020 | 0.48 |
📈 Dividend Growth
Dividend growth is an indicator of financial health and management's confidence in sustainable earnings. Understanding Marriott's historical growth rates helps evaluate its potential for future increases in shareholder returns.
| Time | Growth |
|---|---|
| 3 years | 0.71% |
| 5 years | 0.05% |
The average dividend growth is 0.05% over five years. This shows moderate but steady dividend growth.
📉 Payout Ratio
The payout ratio is critical in assessing the sustainability of dividends. Marriott's EPS payout ratio stands at 26.70%, and the company maintains a free cash flow payout ratio of 33.03%. These indicators suggest a healthy balance between rewarding shareholders and preserving cash for operational needs, though red flags concerning negative leverage ratios must be addressed for long-term stability.
| Key Figure Ratio | Value |
|---|---|
| EPS-based | 26.70% |
| Free cash flow-based | 33.03% |
The current low EPS and FCF payout ratios are favorable in ensuring dividend sustainability, provided the debt structure is aggressively managed.
💹 Cashflow & Capital Efficiency
An assessment of cash flow provides insights into Marriott's financial agility in funding operations and rewarding shareholders. Key to evaluate is the relationship between CAPEX and operational cash flows, alongside free cash flow yields, which currently suggests a robust cash generation framework.
| Year | 2024 | 2023 | 2022 |
|---|---|---|---|
| Free Cash Flow Yield | 2.52% | 4.00% | 4.20% |
| Earnings Yield | 2.99% | 4.53% | 4.88% |
| CAPEX to Operating Cash Flow | 27.28% | 14.26% | 14.05% |
| Stock-based Compensation to Revenue | 0.94% | 0.86% | 0.92% |
| Free Cash Flow / Operating Cash Flow Ratio | 72.72% | 85.74% | 85.95% |
The improving free cash flow ratios signal good management; however, diligence in maintaining such practices is necessary, especially under economic stressors.
🗣️ Balance Sheet & Leverage Analysis
Marriott's financial stability is reinforced by a deep dive into its balance sheet, critical for understanding leverage, liquidity, and debt service capabilities, vital for sustaining dividend policies.
| Year | 2024 | 2023 | 2022 |
|---|---|---|---|
| Debt-to-Equity | -5.09 | -18.71 | 19.54 |
| Debt-to-Assets | 58.21% | 49.70% | 44.72% |
| Debt-to-Capital | 124.43% | 105.65% | 95.13% |
| Net Debt to EBITDA | 3.42 | 2.84 | 2.70 |
| Current Ratio | 0.40 | 0.43 | 0.45 |
| Quick Ratio | 0.40 | 0.43 | 0.45 |
| Financial Leverage | -8.75 | -37.65 | 43.69 |
The negative leverage ratios in recent years point to increased financial risk and weakness in Marriott's debt management strategy. Immediate corrective actions are necessary to avoid future liquidity constraints affecting dividend decisions.
📈 Fundamental Strength & Profitability
Analyzing fundamentals is crucial in gauging Marriott's profitability and capacity to generate returns for its shareholders sustainably. This insight serves as a foundation for future growth and investor rewards.
| Year | 2024 | 2023 | 2022 |
|---|---|---|---|
| Return on Equity | -0.79% | -4.52% | 4.15% |
| Return on Assets | 0.09% | 0.12% | 0.10% |
| Margins (Net) | 9.46% | 13.00% | 11.35% |
| Margins (EBIT) | 15.32% | 16.63% | 16.93% |
| Margins (EBITDA) | 17.28% | 18.47% | 18.86% |
| Margins (Gross) | 20.32% | 21.61% | 21.94% |
| Research & Development to Revenue | 0.00% | 0.00% | 0.00% |
While Marriott has demonstrated sound profitability, the negative ROE figures stand out, driven by recent financial challenges. These metrics should be interpreted cautiously in the context of Marriott's current capital structure.
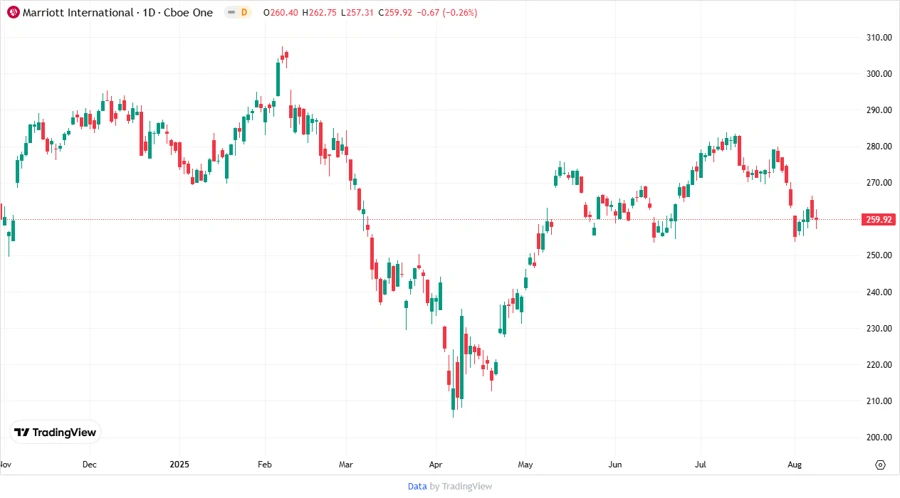
📈 Price Development
📊 Dividend Scoring System
The analysis uses a custom dividend scoring system to provide insights into Marriott's dividend-paying capabilities, considering a variety of factors.
| Category | Score (1-5) | Score Bar |
|---|---|---|
| Dividend Yield | 2 | |
| Dividend Stability | 4 | |
| Dividend Growth | 3 | |
| Payout Ratio | 5 | |
| Financial Stability | 2 | |
| Dividend Continuity | 5 | |
| Cashflow Coverage | 3 | |
| Balance Sheet Quality | 2 |
Total Score: 26/40
✅ Rating
Marriott International, Inc.'s dividends offer a stable income stream, bolstered by historical payouts and low payout ratios. However, financial instability signaled by leverage ratios suggests an imperative re-evaluation of debt management strategies to ensure long-term sustainability. As such, it is recommended for cautious investors prioritizing income with an appetite for moderate risk. Continuous monitoring of the financial restructuring is advised.
Smart Data Insight
Master the Perfect Entry & Exit for this Stock
Don't leave your profits to chance. Historically, this stock follows specific seasonal patterns that institutional traders use to maximize returns.
- ✅ Identify the "Golden Buying Window"
- ✅ Avoid high-risk correction cycles
- ✅ Backtested data from the last 20+ years