July 13, 2025 a 02:47 am

MAR: Dividend Analysis - Marriott International, Inc.
Marriott International, Inc. is a key player in the hospitality sector. While boasting a modest dividend yield of 1.24%, it stands out with 27 consecutive years of dividend payout history. The firm's financial stability and consistent dividend policy make it an attractive choice for long-term income-seeking investors, despite certain short-term financial challenges.
📊 Overview
Marriott International's dividend profile reflects a solid track record, characterized by 27 years of dividend history. Despite a current dividend yield of 1.24%, which is relatively low, the company's commitment to steady dividend payments underscores its resilience in the hospitality sector.
| Metric | Value |
|---|---|
| Sector | Hospitality |
| Dividend yield | 1.24 % |
| Current dividend per share | 2.40 USD |
| Dividend history | 27 years |
| Last cut or suspension | None |
📉 Dividend History
Examining the dividend history of Marriott International highlights its consistency and reliability in dividend payments. This is crucial for long-term investors seeking income streams.
| Year | Dividend per Share (USD) |
|---|---|
| 2025 | 1.30 |
| 2024 | 2.41 |
| 2023 | 1.96 |
| 2022 | 1.00 |
| 2020 | 0.48 |
📈 Dividend Growth
Dividend growth is a vital aspect of a healthy dividend strategy. For Marriott International, a modest dividend growth rate of 0.71% over three years and 5.43% over five years suggests steady, albeit slow, financial stability.
| Time | Growth |
|---|---|
| 3 years | 0.71 % |
| 5 years | 5.43 % |
The average dividend growth is 5.43% over 5 years. This shows moderate but steady dividend growth.
✅ Payout Ratio
Analyzing the payout ratio assists in evaluating dividend sustainability. Marriott's EPS payout ratio is 26.97%, while the free cash flow-based payout ratio is 35.70%. Both figures indicate a healthy buffer, emphasizing sustainability in maintaining current dividend levels.
| Key figure | Ratio |
|---|---|
| EPS-based | 26.97 % |
| Free Cash Flow-based | 35.70 % |
With a payout ratio of 26.97% (EPS) and 35.70% (FCF), Marriott demonstrates a prudent approach to balancing reinvestment and shareholder returns.
📈 Cashflow & Capital Efficiency
The cash flow analysis for Marriott underscores efficient management, with a free cash flow yield of 2.39% and a CAPEX to operating cash flow ratio of 29.65%. These metrics indicate robust capital efficiency and judicious investment in growth opportunities.
| Year | 2024 | 2023 | 2022 |
|---|---|---|---|
| Free Cash Flow Yield | 2.52% | 4.00% | 4.20% |
| Earnings Yield | 2.99% | 4.53% | 4.88% |
| CAPEX to Operating Cash Flow | 27.28% | 14.26% | 14.05% |
| Stock-based Compensation to Revenue | 0.94% | 0.86% | 0.92% |
| Free Cash Flow / Operating Cash Flow Ratio | 72.72% | 85.74% | 85.95% |
Overall, the stability of Marriott's cash flow is supported by its robust free cash flow yield and prudent capital allocations.
📈 Balance Sheet & Leverage Analysis
Marriott's balance sheet reveals a complex leverage profile with a high debt-to-equity ratio of -5.09 in 2024, indicating potential risk. However, its net debt to EBITDA ratio of 3.69 suggests manageable leverage levels for operational continuity.
| Year | 2024 | 2023 | 2022 |
|---|---|---|---|
| Debt-to-Equity | -5.09 | -18.71 | 19.54 |
| Debt-to-Assets | 58.21% | 49.70% | 44.72% |
| Debt-to-Capital | 124.43% | 105.65% | 95.13% |
| Net Debt to EBITDA | 3.69 | 2.94 | 2.85 |
| Current Ratio | 0.45 | 0.43 | 0.45 |
| Quick Ratio | 0.40 | 0.43 | 0.45 |
| Financial Leverage | -8.75 | -37.65 | 43.69 |
The balance sheet reflects a growing reliance on leverage, suggesting caution is required in managing the financial structure to ensure stability.
📈 Fundamental Strength & Profitability
Key profitability indicators for Marriott include negative return on equity values in recent years. In 2022, a notable positive return on equity of 4.15% indicates potential improvement. Strong gross and EBITDA margins further showcase operational efficiency.
| Year | 2024 | 2023 | 2022 |
|---|---|---|---|
| Return on Equity | -0.79% | -4.52% | 4.15% |
| Return on Assets | 9.07% | 12.01% | 9.50% |
| Net Margin | 9.46% | 13.00% | 11.35% |
| EBITDA Margin | 16.84% | 17.80% | 17.92% |
| Gross Margin | 21.59% | 21.61% | 21.94% |
| R&D to Revenue | 0.00% | 0.00% | 0.00% |
The fundamental metrics display a company with potential profitability challenges but beneficial operational leverage, aiding in margin stability.
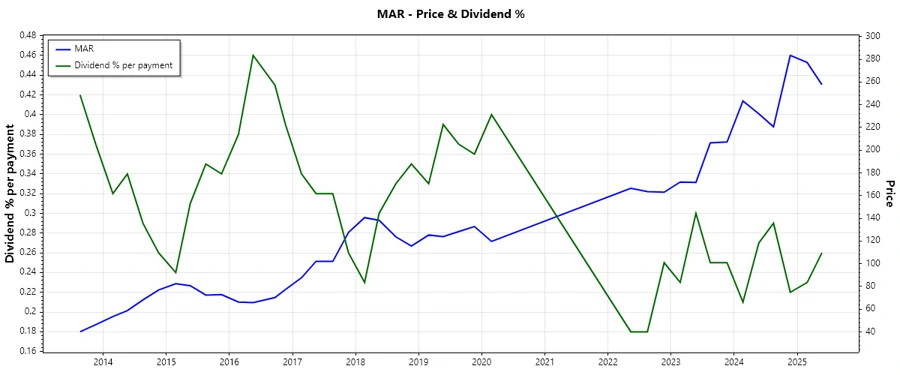
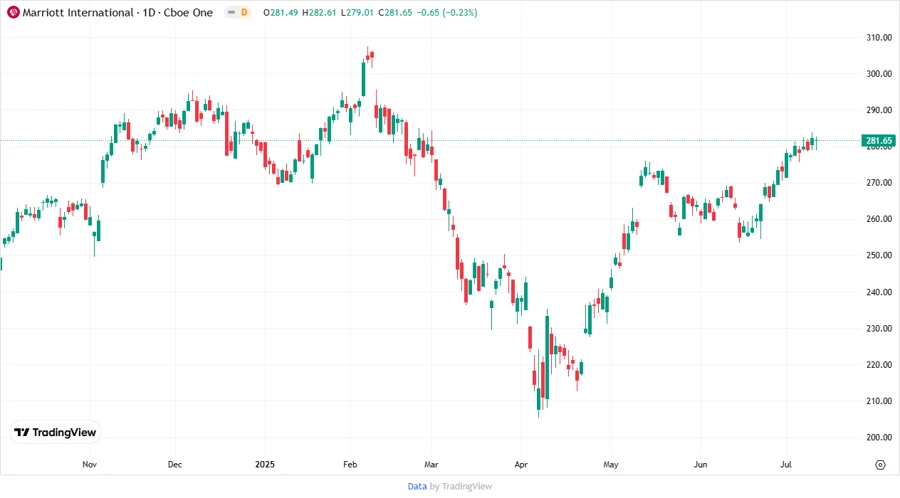
📊 Price Development
Dividend Scoring System
| Category | Score (1-5) | Score Bar |
|---|---|---|
| Dividend yield | 2 | |
| Dividend Stability | 4 | |
| Dividend growth | 3 | |
| Payout ratio | 4 | |
| Financial stability | 3 | |
| Dividend continuity | 5 | |
| Cashflow Coverage | 3 | |
| Balance Sheet Quality | 2 |
Total Score: 26/40
Rating
In conclusion, Marriott International stands out for its stable dividend policy and strong sector presence, offering reliable income opportunities for investors. However, leverage challenges and modest yield values suggest cautious optimism. Future improvements in profitability metrics are vital for an enhanced investment thesis.
Smart Data Insight
Master the Perfect Entry & Exit for this Stock
Don't leave your profits to chance. Historically, this stock follows specific seasonal patterns that institutional traders use to maximize returns.
- ✅ Identify the "Golden Buying Window"
- ✅ Avoid high-risk correction cycles
- ✅ Backtested data from the last 20+ years