April 25, 2026 a 06:00 pm

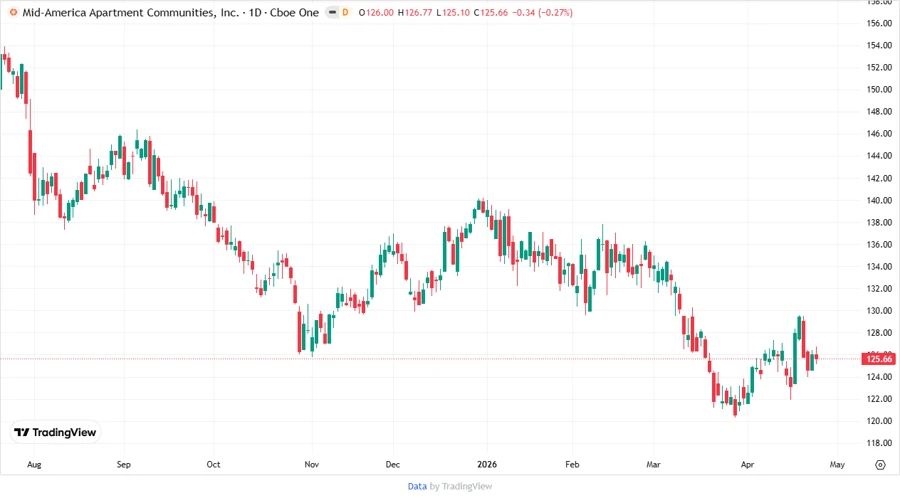
MAA: Fundamental Ratio Analysis - Mid-America Apartment Communities, Inc.
Mid-America Apartment Communities, Inc. (MAA) operates as a real estate investment trust (REIT) and is part of the S&P 500. Focused on high-performance investing, MAA curates premium apartment communities across key US regions. Despite being a strong player, potential investors should consider sector volatility and market conditions.
Fundamental Rating
The fundamental analysis presents a solid performance of MAA with room for improvement in specific areas. Below are the valuation categories and scores:
| Category | Score | |
|---|---|---|
| Discounted Cash Flow | 4 | |
| Return on Equity | 4 | |
| Return on Assets | 5 | |
| Debt to Equity | 2 | |
| Price to Earnings | 1 | |
| Price to Book | 2 |
Historical Rating
The historical data highlights stable yet evolving ratings over time, with the most recent scores shown below:
| Date | Overall | DCF | ROE | ROA | D/E | P/E | P/B |
|---|---|---|---|---|---|---|---|
| 2026-04-24 | 3 | 4 | 4 | 5 | 2 | 1 | 2 |
| Previous Date | 0 | 4 | 4 | 5 | 2 | 1 | 2 |
Analyst Targets
Analyst price targets provide a range which reflects both optimism and caution. The details are presented below:
| High | Low | Median | Consensus |
|---|---|---|---|
| 158 | 134 | 142.5 | 144.21 |
Analyst Sentiment
The consensus among analysts points to a cautious 'Buy' with a sizable 'Hold' sentiment. Breakdown of recommendations is as follows:
| Recommendation | Count | |
|---|---|---|
| Strong Buy | 0 | |
| Buy | 18 | |
| Hold | 18 | |
| Sell | 1 | |
| Strong Sell | 0 |
Conclusion
The MAA stock demonstrates a robust portfolio within the real estate sector, leveraging its REIT model to deliver value. Current ratings indicate solid performance across key metrics, though debt-to-equity ratios and P/E valuations suggest caution. With a 'Buy' consensus, MAA holds potential, albeit with standard market risks for its industry. Investors should weigh its stable dividends against broader economic trends and policy shifts impacting real estate.
Smart Data Insight
Master the Perfect Entry & Exit for this Stock
Don't leave your profits to chance. Historically, this stock follows specific seasonal patterns that institutional traders use to maximize returns.
- ✅ Identify the "Golden Buying Window"
- ✅ Avoid high-risk correction cycles
- ✅ Backtested data from the last 20+ years