May 08, 2026 a 04:44 pm

MAA: Fibonacci Analysis - Mid-America Apartment Communities, Inc.
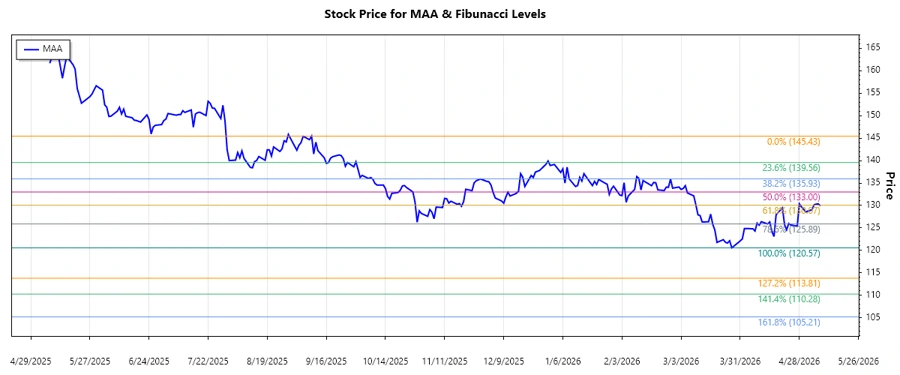
Mid-America Apartment Communities, Inc. (MAA), as a leading REIT, continues to exhibit resilience in its stock performance. The company's strategic focus on high-demand regions like the Southeast and Southwest U.S. positions it well for growth. Recent technical indicators suggest potential trading opportunities as the market adjusts from previous peaks and troughs.
Fibonacci Analysis
| Description | Details |
|---|---|
| Start Date of Trend | 2025-09-11 |
| End Date of Trend | 2026-03-09 |
| High Point (Price & Date) | $145.43 on 2025-09-09 |
| Low Point (Price & Date) | $120.57 on 2026-03-27 |
| Current Price | $129.92 |
| 23.6% Fibonacci Level | $125.98 |
| 38.2% Fibonacci Level | $130.12 |
| 50% Fibonacci Level | $132.81 |
| 61.8% Fibonacci Level | $135.50 |
| 78.6% Fibonacci Level | $138.94 |
| Retracement Zone | Current price is within the 23.6% - 38.2% retracement zone |
| Technical Interpretation | The current price is likely to find support around the 23.6% level, with potential resistance near the 38.2% level. |
Conclusion
The technical analysis of MAA suggests cautious optimism in the short term. The stock has shown resilience by rebounding into the 23.6% - 38.2% Fibonacci retracement zone, offering potential support and resistance levels for traders. With its strategic foothold in growing markets, MAA remains a notable player in the real estate sector, albeit with market volatility risks. Analysts should keep an eye on macroeconomic factors that could influence the REIT's performance.
Smart Data Insight
Master the Perfect Entry & Exit for this Stock
Don't leave your profits to chance. Historically, this stock follows specific seasonal patterns that institutional traders use to maximize returns.
- ✅ Identify the "Golden Buying Window"
- ✅ Avoid high-risk correction cycles
- ✅ Backtested data from the last 20+ years