March 18, 2026 a 06:45 am
MAA: Fibonacci Analysis - Mid-America Apartment Communities, Inc.
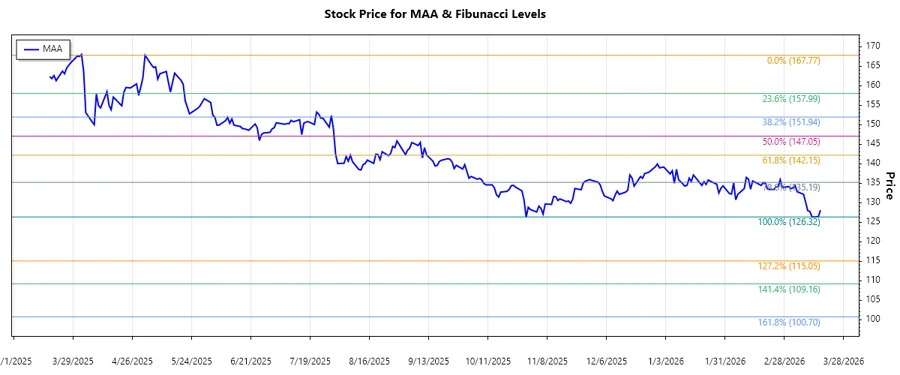
The stock of Mid-America Apartment Communities, Inc. (MAA) has displayed significant volatility over the past months. Despite some fluctuations, there seems to be an overall decline in the price. Investors should be cautious as the stock currently exhibits a downward trend. Careful consideration of strategic entry and exit points will be crucial for potential investors.
Fibonacci Analysis
| Description | Details |
|---|---|
| Start Date | 2025-05-02 |
| End Date | 2026-03-17 |
| High Price | $167.77 on 2025-05-02 |
| Low Price | $126.32 on 2026-03-13 |
Fibonacci Retracement Levels
| Level | Price |
|---|---|
| 0.236 | $145.68 |
| 0.382 | $138.87 |
| 0.5 | $131.42 |
| 0.618 | $123.97 |
| 0.786 | $115.44 |
The current price of $128.07 is within the 0.382 retracement zone, suggesting a potential support level, where the stock might stabilize or continue its downtrend. Investors should watch closely for price action around this level for clues about future movements.
Conclusion
The analysis of MAA stock shows a prevailing downward trend over recent months. The current position in the 0.382 Fibonacci retracement zone suggests potential support for the stock. However, if this level fails to hold, further declines could be expected. While there might be opportunities for short-term gains, the overall risk remains high. Investors should be cautious and ensure thorough research and analysis before making investment decisions in MAA stock.