
June 11, 2026 a 07:46 am

📊 MAA: Dividend Analysis - Mid-America Apartment Communities, Inc.
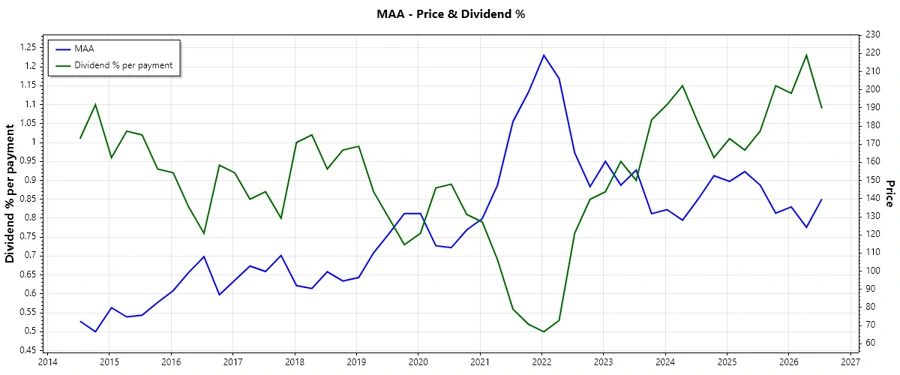
Mid-America Apartment Communities, Inc. (MAA) demonstrates a notable dividend profile with steady growth over 33 years, making it a potential candidate for income-focused investors. Despite a high EPS payout ratio, the long dividend history suggests commitment to shareholder returns. With a yield over 4%, MAA offers attractive income potential amidst the real estate sector landscape.
📄 Overview
Mid-America Apartment Communities, Inc. (MAA) operates in the Real Estate Investment Trusts (REITs) sector, maintaining a dividend yield of 4.37% with a current dividend per share of $6.092. The company has consistently paid dividends for 33 years, displaying robust dividend continuity although it is pertinent to note the elevated EPS payout ratio.
| Sector | Dividend Yield | Current Dividend Per Share | Dividend History Years | Last Cut or Suspension |
|---|---|---|---|---|
| Real Estate Investment Trusts (REITs) | 4.37% | 6.09 USD | 33 years | None |
🔍 Dividend History
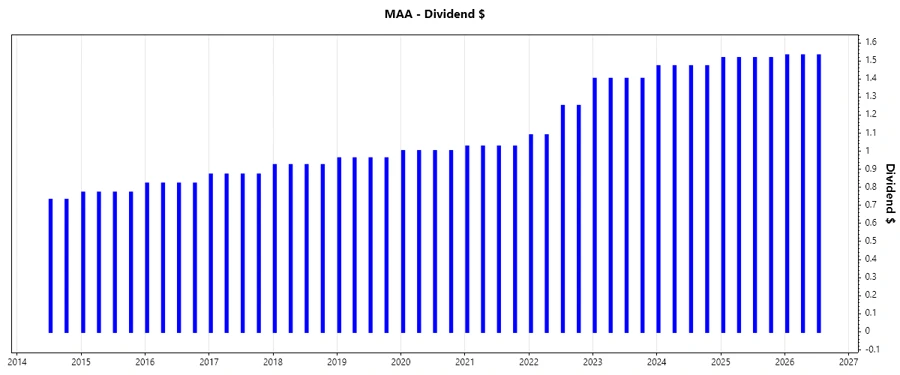
The company's dividend history is an essential measure of its long-term financial health and shareholder return policy. A track record of consistent dividend payments may reflect financial stability and a shareholder-centric management approach.
| Year | Dividend Per Share (USD) |
|---|---|
| 2026 | 4.59 |
| 2025 | 6.06 |
| 2024 | 5.88 |
| 2023 | 5.60 |
| 2022 | 4.675 |
📈 Dividend Growth
Analyzing dividend growth provides insights into future distribution potential, reflecting the company’s ability to increase shareholder returns over time. MAA's growth rates indicate a CAGR of 9.03% for the past 3 years and 8.66% over 5 years.
| Time | Growth |
|---|---|
| 3 years | 9.03% |
| 5 years | 8.66% |
The average dividend growth is 8.66% over 5 years. This shows moderate but steady dividend growth.
💡 Payout Ratio
Payout ratios are a critical metric for assessing dividend sustainability. High payout ratios can indicate potential risk which may affect future payments if earnings decline.
| Key figure | Ratio |
|---|---|
| EPS-based | 182.10% |
| Free cash flow-based | 116.24% |
The EPS payout ratio at 182.10% is concerning and suggests dividends could be financed through debt rather than earnings, posing a risk to sustainability.
💰 Cashflow & Capital Efficiency
An essential aspect of financial health is the efficacy of cash flow management and capital allocation. MAA’s figures suggest ongoing efforts to capitalize on operating efficiencies to enhance capital deployment and returns.
| Year | 2025 | 2024 | 2023 |
|---|---|---|---|
| Free Cash Flow Yield | 4.42% | 4.30% | 5.08% |
| Earnings Yield | 2.75% | 2.92% | 3.53% |
| CAPEX to Operating Cash Flow | 33.41% | 29.35% | 30.01% |
| Stock-based Compensation to Revenue | 0.76% | 0.72% | 0.73% |
| Free Cash Flow / Operating Cash Flow Ratio | 66.59% | 70.65% | 69.99% |
MAA's operational cash flow coverage underscores its ability to efficiently service obligations while pursuing growth and returning capital to shareholders.
📊 Balance Sheet & Leverage Analysis
Understanding leverage dynamics and balance sheet robustness provides insights into a company's fiscal health. It is crucial to gauge balance sheet flexibility in meeting obligations without compromising growth.
| Year | 2025 | 2024 | 2023 |
|---|---|---|---|
| Debt-to-Equity | 0.95 | 0.84 | 0.75 |
| Debt-to-Assets | 0.45 | 0.42 | 0.40 |
| Debt-to-Capital | 0.49 | 0.46 | 0.43 |
| Net Debt to EBITDA | 4.05 | 3.82 | 3.52 |
| Current Ratio | 0.16 | 0.08 | 0.05 |
| Quick Ratio | 0.16 | 0.08 | 0.05 |
| Financial Leverage | 2.11 | 1.98 | 1.88 |
MAA's leverage ratios suggest prudent management of borrowing, allowing strategic flexibility while maintaining solvency.
📈 Fundamental Strength & Profitability
Profitability ratios serve as indicators of financial performance efficiency, measuring how effectively a company converts revenues into profit and value for shareholders.
| Year | 2025 | 2024 | 2023 |
|---|---|---|---|
| Return on Equity | 7.86% | 8.84% | 9.04% |
| Return on Assets | 3.73% | 4.47% | 4.81% |
| Margins: Net | 20.23% | 24.08% | 25.73% |
| Margins: EBIT | 31.50% | 32.56% | 33.52% |
| Margins: EBITDA | 59.69% | 59.32% | 59.85% |
| Margins: Gross | 31.83% | 32.55% | 34.79% |
| Research & Development to Revenue | 0.00% | 0.00% | 0.00% |
MAA's fundamental strength is reflected in its robust return ratios and sustaining margins, presenting a commendable outlook for consistent profitability.
📉 Price Development
⭐ Dividend Scoring System
| Category | Score | Bar |
|---|---|---|
| Dividend yield | 4 | |
| Dividend Stability | 5 | |
| Dividend growth | 4 | |
| Payout ratio | 2 | |
| Financial stability | 4 | |
| Dividend continuity | 5 | |
| Cashflow Coverage | 3 | |
| Balance Sheet Quality | 4 |
Total Score: 31/40
✅ Rating
Mid-America Apartment Communities, Inc. holds a strong dividend presence with commendable growth and consistency. However, the relatively elevated payout ratio could signify caution. Investors seeking dividend-focused portfolios may find MAA a solid option, contingent on future earnings trajectory and payout adjustments.
Smart Data Insight
Master the Perfect Entry & Exit for this Stock
Don't leave your profits to chance. Historically, this stock follows specific seasonal patterns that institutional traders use to maximize returns.
- ✅ Identify the "Golden Buying Window"
- ✅ Avoid high-risk correction cycles
- ✅ Backtested data from the last 20+ years